PROTECTED SOURCE SCRIPT
Relative Strength of Stocks - Moti Rakam
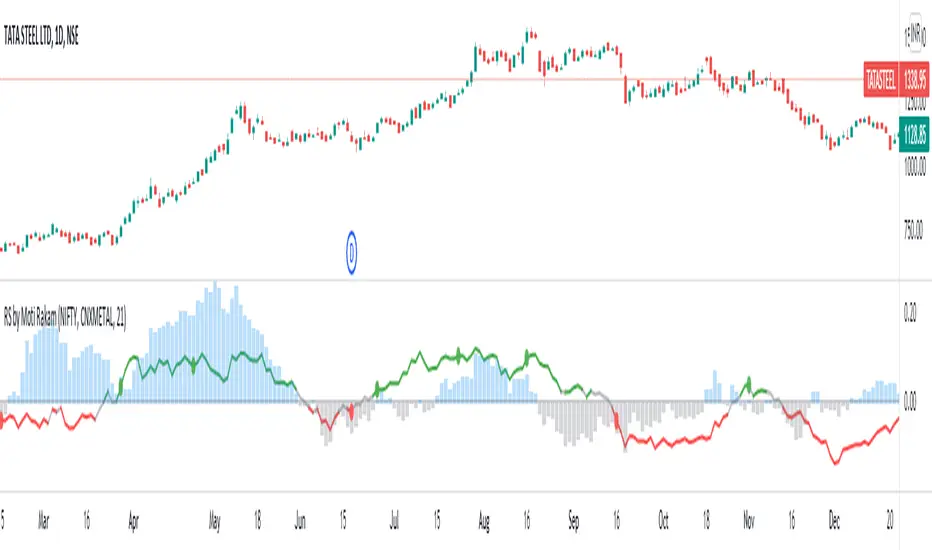
The indicator plots "Relative Strength" (RS) of a stock, in 2 ways:
1. Relative Strength of the sector index, against the wider market index. For example, in Indian market relative strength of any sector index like CNXAUTO or CNXMETAL, against NIFTY. RS of sector index against wider market index is plotted in "Columns". Blue color of Columns above zero line signifies that "Sector Index is outperforming the Wider Market Index". Gray color Columns under zero line signifies that "Sector Index is underperforming the Wider Market Index".
2. Relative Strength of the stock against it's sector index. For example, in Indian market, RS of TATA STEEL against CNXMETAL. The Stock RS is plotted with a line. Green color of RS line above 0.02 signifies that "Stock is outperforming it's sector index". Red color of RS line below -0.02 signifies that "Stock is underperforming it's sector index". Gray color of RS line between 0.02 and -0.02 represents neutral zone.
IMPORTANT: Right method to ascertain RS of a stock would be to look for the zones where 2 RS (sector RS and stock RS) are in consensus/confluence. For example, RS line of TATA STEEL is in green color and at the same time the CNXMETAL is also in Blue columns against NIFTY.
Mã được bảo vệ
Tập lệnh này được đăng dưới dạng mã nguồn đóng. Tuy nhiên, bạn có thể sử dụng tự do và không giới hạn – tìm hiểu thêm tại đây.
@MotiRakam
Thông báo miễn trừ trách nhiệm
Thông tin và các ấn phẩm này không nhằm mục đích, và không cấu thành, lời khuyên hoặc khuyến nghị về tài chính, đầu tư, giao dịch hay các loại khác do TradingView cung cấp hoặc xác nhận. Đọc thêm tại Điều khoản Sử dụng.