PROTECTED SOURCE SCRIPT
TRADE ORBIT:-Average Directional Index with Color Zones
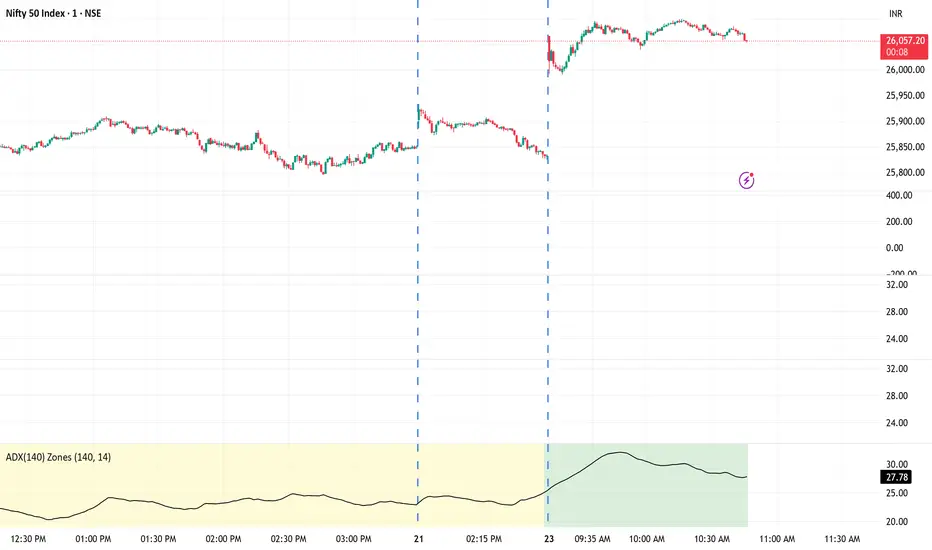
This indicator is a long-term smoothed version of the Average Directional Index (ADX) designed to measure trend strength while filtering out short-term noise.
It applies a 140-period smoothing to the ADX calculation, making it ideal for swing or positional traders who want to identify sustained trends rather than short-lived moves.
🎯 How It Works
The ADX(140) measures the strength of the current trend, regardless of direction.
The background color automatically changes based on the ADX value range to visually highlight the market condition.
ADX Range Background Color Interpretation
0–25 🟡 Yellow Weak trend / ranging market
25–50 🟢 Green Moderate trend strength
50–75 🔵 Blue Strong trend
75–100 🔴 Red Very strong / overheated trend
Horizontal reference lines are also plotted at 0, 25, 50, 75, and 100 to make the trend zones clear.
Mã được bảo vệ
Tập lệnh này được đăng dưới dạng mã nguồn đóng. Tuy nhiên, bạn có thể tự do sử dụng tập lệnh mà không có bất kỳ hạn chế nào – tìm hiểu thêm tại đây.
Thông báo miễn trừ trách nhiệm
Thông tin và ấn phẩm không có nghĩa là và không cấu thành, tài chính, đầu tư, kinh doanh, hoặc các loại lời khuyên hoặc khuyến nghị khác được cung cấp hoặc xác nhận bởi TradingView. Đọc thêm trong Điều khoản sử dụng.