PROTECTED SOURCE SCRIPT
Strong Indicator for ISM PMI EURUSD (mtbr)
Overview:
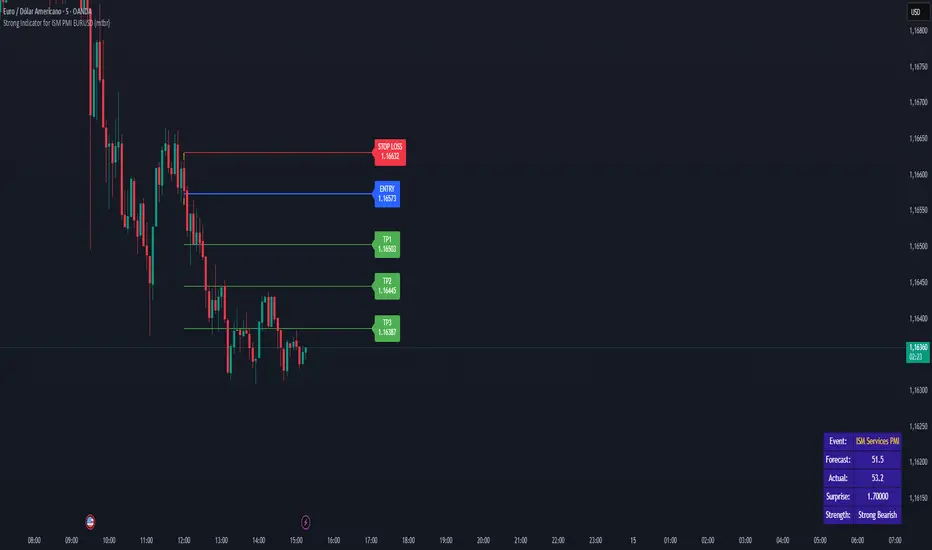
This indicator is designed for EURUSD traders who want to analyse the market's reaction to the ISM Services PMI economic event. It automatically detects the event candle, calculates the “surprise” between Actual and Forecast, and generates a full trading plan with entry, take profit, and stop loss levels.
How it works:
Set the event time (or a custom date/time) and input Forecast, Previous, and Actual values.
The indicator calculates the surprise: Actual − Forecast.
Based on the surprise magnitude, it classifies the strength as Weak, Moderate, or Strong, and as Bullish or Bearish.
Direction is set automatically but can be inverted via the “Invert Signal Logic” option.
Entry, TP1, TP2, TP3, and SL are calculated based on your percentage settings.
Levels are plotted on the chart, with labels and a vertical dashed line marking the event candle.
A table displays key event data: name, forecast, actual, surprise, and strength classification.
How to use:
Select your trading asset (EURUSD by default).
Choose between automatic event time logic or a custom date/time.
Input the Forecast, Previous, and Actual values from the economic calendar.
Adjust percentage settings for entry, take profits, and stop loss.
Use the plotted lines as a reference for trade planning.
Optionally enable pullback confirmation before entry.
Disclaimer:
This tool is for educational and analytical purposes only. It is not financial advice. Always use proper risk management and perform independent analysis before trading.
Mã được bảo vệ
Tập lệnh này được đăng dưới dạng mã nguồn đóng. Tuy nhiên, bạn có thể sử dụng tự do và không giới hạn – tìm hiểu thêm tại đây.
Thông báo miễn trừ trách nhiệm
Thông tin và các ấn phẩm này không nhằm mục đích, và không cấu thành, lời khuyên hoặc khuyến nghị về tài chính, đầu tư, giao dịch hay các loại khác do TradingView cung cấp hoặc xác nhận. Đọc thêm tại Điều khoản Sử dụng.