OPEN-SOURCE SCRIPT
Cập nhật Volume Price Balance by serkany88
This idea has been in my mind for a while. We all know how important volume is to technical analysis but volume and price itself doesn't mean much when volatility and momentum of the current trend is not taken into account. With this oscillator we try to combine all these factors into one indicator and provide a simplified interpretation of this relationship with spread analysis. This indicator can be used in all timeframes but higher timeframes like 1 hour and above will provide most stable results.
How it works?
This oscillator tries to analyze volume spread along with price spread based on wyckoff methods and attains certain "strength value" for each candle and it's relationship with the volume. After this calculation preferably we remove detected rejection candles from overall calculation and draw them as plots. The multipliers of the strengths can be changed from the settings.
Let's check the example below

As you can see we see a green dot appear in a somewhat weakening bullish momentum, this can mean possible reversal can happen soon and it does.
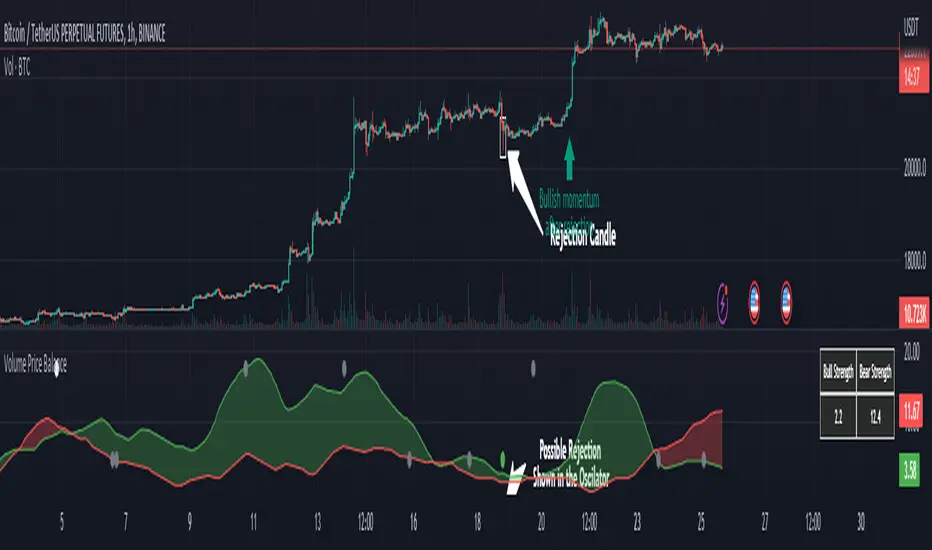
Below is a bearish example

In this example we see a possible strong reversal signal in a increasing bullish momentum and the price reacts immediately after the candle.
We also have a table that shows the current non-smoothed result of trend strength based on calculated price-volume spread at top right of the oscillator.
How it works?
This oscillator tries to analyze volume spread along with price spread based on wyckoff methods and attains certain "strength value" for each candle and it's relationship with the volume. After this calculation preferably we remove detected rejection candles from overall calculation and draw them as plots. The multipliers of the strengths can be changed from the settings.
- Green Line Above Red Line = Bullish momentum stronger
- Red Line Above Green Line = Bearish momentum stronger
- Top circles mean possible bullish reversal candle detected. Gray is weak, White is normal and Red top circle means strong possible reversal detected.
- Bottom circles mean possible bearish reversal candle detected. Gray is weak, White is normal and Green bottom circle means strong possible reversal detected.
Let's check the example below
As you can see we see a green dot appear in a somewhat weakening bullish momentum, this can mean possible reversal can happen soon and it does.
Below is a bearish example
In this example we see a possible strong reversal signal in a increasing bullish momentum and the price reacts immediately after the candle.
We also have a table that shows the current non-smoothed result of trend strength based on calculated price-volume spread at top right of the oscillator.
Phát hành các Ghi chú
Added alerts for single or all rejections.Mã nguồn mở
Theo đúng tinh thần TradingView, tác giả của tập lệnh này đã công bố nó dưới dạng mã nguồn mở, để các nhà giao dịch có thể xem xét và xác minh chức năng. Chúc mừng tác giả! Mặc dù bạn có thể sử dụng miễn phí, hãy nhớ rằng việc công bố lại mã phải tuân theo Nội quy.
One does not simply win every trade.
Thông báo miễn trừ trách nhiệm
Thông tin và các ấn phẩm này không nhằm mục đích, và không cấu thành, lời khuyên hoặc khuyến nghị về tài chính, đầu tư, giao dịch hay các loại khác do TradingView cung cấp hoặc xác nhận. Đọc thêm tại Điều khoản Sử dụng.
Mã nguồn mở
Theo đúng tinh thần TradingView, tác giả của tập lệnh này đã công bố nó dưới dạng mã nguồn mở, để các nhà giao dịch có thể xem xét và xác minh chức năng. Chúc mừng tác giả! Mặc dù bạn có thể sử dụng miễn phí, hãy nhớ rằng việc công bố lại mã phải tuân theo Nội quy.
One does not simply win every trade.
Thông báo miễn trừ trách nhiệm
Thông tin và các ấn phẩm này không nhằm mục đích, và không cấu thành, lời khuyên hoặc khuyến nghị về tài chính, đầu tư, giao dịch hay các loại khác do TradingView cung cấp hoặc xác nhận. Đọc thêm tại Điều khoản Sử dụng.