OPEN-SOURCE SCRIPT
GMMA Toolkit [QuantVue]
The GMMA Toolkit is designed to leverage the principles of the Guppy Multiple Moving Average (GMMA). This indicator is equipped with multiple features to help traders identify trends, reversals, and periods of market compression.
The Guppy Multiple Moving Average (GMMA) is a technical analysis tool developed by Australian trader and author Daryl Guppy in the late 1990s.
It utilizes two sets of Exponential Moving Averages (EMAs) to capture both short-term and long-term market trends. The short-term EMAs represent the activity of traders, while the long-term EMAs reflect the behavior of investors.
By analyzing the interaction between these two groups of EMAs, traders can identify the strength and direction of trends, as well as potential reversals.

Due to the nature of GMMA, charts can become cluttered with numerous lines, making analysis challenging.
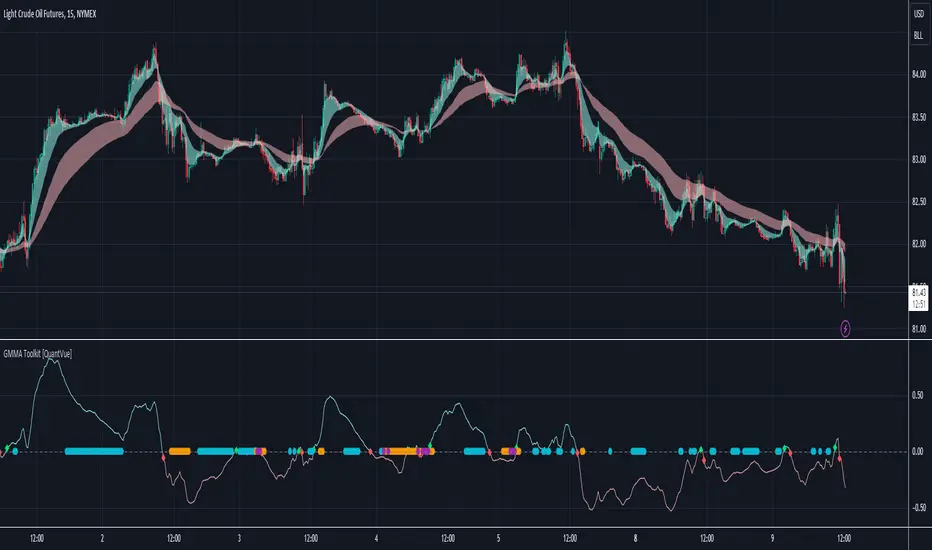
However, this indicator simplifies visualization by using clouds to represent the short-term and long-term EMA groups, determined by filling the area between the maximum and minimum EMAs in each group.

The GMMA Toolkit goes a step further and includes an oscillator that measures the difference between the average short-term and long-term EMAs, providing a clear visual representation of trend strength and direction.
The farther the oscillator is from the 0 level, the stronger the trend. It is plotted on a separate panel with values above zero indicating bullish conditions and values below zero indicating bearish conditions.

The inclusion of the oscillator in the GMMA Toolkit allows traders to identify earlier buy and sell signals based on the GMMA oscillator crossing the zero line compared to traditional crossover methods.

Lastly, the GMMA Toolkit features compression dots that indicate periods of market consolidation.
By measuring the spread between the maximum and minimum EMAs within both short-term and long-term groups, the indicator identifies when these spreads are significantly narrower than average by comparing the current spread to the average spread over a lookback period.
This visual cue helps traders anticipate potential breakout or breakdown scenarios, enhancing their ability to react to imminent trend changes.

By simplifying the visualization of the Guppy Multiple Moving Averages with clouds, providing earlier buy and sell signals through the oscillator, and highlighting periods of market consolidation with compression dots, this toolkit offers traders insightful tools for navigating market trends and potential reversals.
Give this indicator a BOOST and COMMENT your thoughts below!
We hope you enjoy.
Cheers!
The Guppy Multiple Moving Average (GMMA) is a technical analysis tool developed by Australian trader and author Daryl Guppy in the late 1990s.
It utilizes two sets of Exponential Moving Averages (EMAs) to capture both short-term and long-term market trends. The short-term EMAs represent the activity of traders, while the long-term EMAs reflect the behavior of investors.
By analyzing the interaction between these two groups of EMAs, traders can identify the strength and direction of trends, as well as potential reversals.
Due to the nature of GMMA, charts can become cluttered with numerous lines, making analysis challenging.
However, this indicator simplifies visualization by using clouds to represent the short-term and long-term EMA groups, determined by filling the area between the maximum and minimum EMAs in each group.
The GMMA Toolkit goes a step further and includes an oscillator that measures the difference between the average short-term and long-term EMAs, providing a clear visual representation of trend strength and direction.
The farther the oscillator is from the 0 level, the stronger the trend. It is plotted on a separate panel with values above zero indicating bullish conditions and values below zero indicating bearish conditions.
The inclusion of the oscillator in the GMMA Toolkit allows traders to identify earlier buy and sell signals based on the GMMA oscillator crossing the zero line compared to traditional crossover methods.
Lastly, the GMMA Toolkit features compression dots that indicate periods of market consolidation.
By measuring the spread between the maximum and minimum EMAs within both short-term and long-term groups, the indicator identifies when these spreads are significantly narrower than average by comparing the current spread to the average spread over a lookback period.
This visual cue helps traders anticipate potential breakout or breakdown scenarios, enhancing their ability to react to imminent trend changes.
By simplifying the visualization of the Guppy Multiple Moving Averages with clouds, providing earlier buy and sell signals through the oscillator, and highlighting periods of market consolidation with compression dots, this toolkit offers traders insightful tools for navigating market trends and potential reversals.
Give this indicator a BOOST and COMMENT your thoughts below!
We hope you enjoy.
Cheers!
Mã nguồn mở
Theo đúng tinh thần TradingView, tác giả của tập lệnh này đã công bố nó dưới dạng mã nguồn mở, để các nhà giao dịch có thể xem xét và xác minh chức năng. Chúc mừng tác giả! Mặc dù bạn có thể sử dụng miễn phí, hãy nhớ rằng việc công bố lại mã phải tuân theo Nội quy.
Get Access to the exclusive QuantVue indicators: quantvue.io/
Join thousands of traders in our Free Discord: discord.gg/tC7u7magU3
Join thousands of traders in our Free Discord: discord.gg/tC7u7magU3
Thông báo miễn trừ trách nhiệm
Thông tin và các ấn phẩm này không nhằm mục đích, và không cấu thành, lời khuyên hoặc khuyến nghị về tài chính, đầu tư, giao dịch hay các loại khác do TradingView cung cấp hoặc xác nhận. Đọc thêm tại Điều khoản Sử dụng.