PROTECTED SOURCE SCRIPT
Cập nhật US Recessions with SPX reversals v3 [FornaxTV]
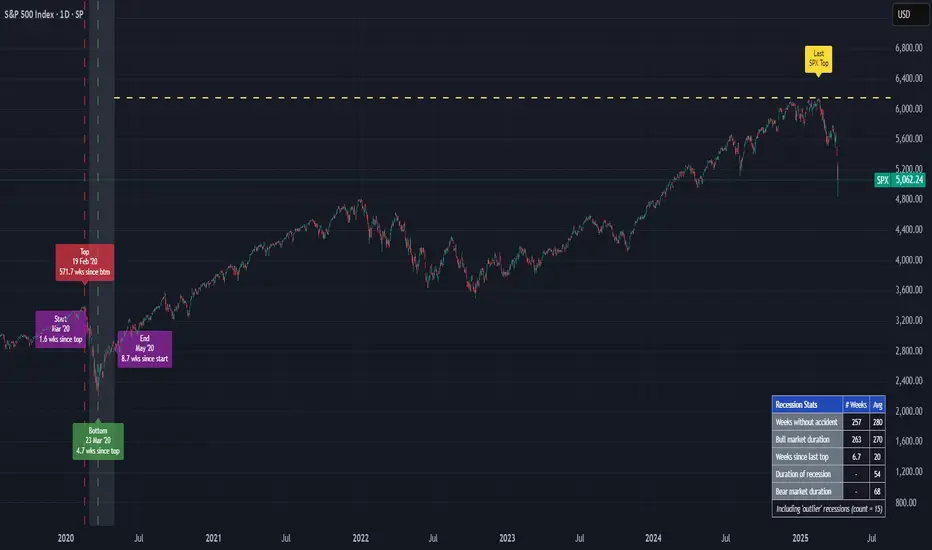
In addition to highlighting periods of official US recessions (as defined by the NBER) this script also displays vertical lines for the SPX market top and bottom associated with each recession.
This facilitates more detailed analysis of potential leading and coincident indicators for market tops and bottoms. This is particularly relevant for market tops, which typically precede the start of a recession by several months.
In addition to recessions with SPX market tops and market bottoms:
- A horizontal line can optionally be displayed for the last market top. (NOTE: this line will only be displayed for SPX tickers.)
- Labels can optionally be displayed for market tops & bottoms, plus the start and end of recessions. If the statistics are enabled (see below) these labels will also indicate the number of weeks between key market events, e.g. a market top and the start of a recession.
- A statistics table can optionally be displayed, contained statistics such as the number of weeks wince the last recession & market bottom, as well as averages for all recessions included in the analysis set.
For the recession statistics:
- "Outlier" recessions such as 1945 (WWII, where the market top occurred well after the recession itself) and 2020 (COVID pandemic, which was arguably not a "true" economic recession) can optionally be excluded.
- You can choose to exclude recessions occurring before a specific year.
Phát hành các Ghi chú
Fixed issue with "Last SPX Top" label displayPhát hành các Ghi chú
Minor improvements to the (optional) summary table. All stats will be highlighted yellow if the current value exceeds the historical average, or red if the current value exceeds the historical average by more than 10%.Mã được bảo vệ
Tập lệnh này được đăng dưới dạng mã nguồn đóng. Tuy nhiên, bạn có thể sử dụng tự do và không giới hạn – tìm hiểu thêm tại đây.
Thông báo miễn trừ trách nhiệm
Thông tin và các ấn phẩm này không nhằm mục đích, và không cấu thành, lời khuyên hoặc khuyến nghị về tài chính, đầu tư, giao dịch hay các loại khác do TradingView cung cấp hoặc xác nhận. Đọc thêm tại Điều khoản Sử dụng.
Mã được bảo vệ
Tập lệnh này được đăng dưới dạng mã nguồn đóng. Tuy nhiên, bạn có thể sử dụng tự do và không giới hạn – tìm hiểu thêm tại đây.
Thông báo miễn trừ trách nhiệm
Thông tin và các ấn phẩm này không nhằm mục đích, và không cấu thành, lời khuyên hoặc khuyến nghị về tài chính, đầu tư, giao dịch hay các loại khác do TradingView cung cấp hoặc xác nhận. Đọc thêm tại Điều khoản Sử dụng.