OPEN-SOURCE SCRIPT
Enhanced Price Z-Score Oscillator
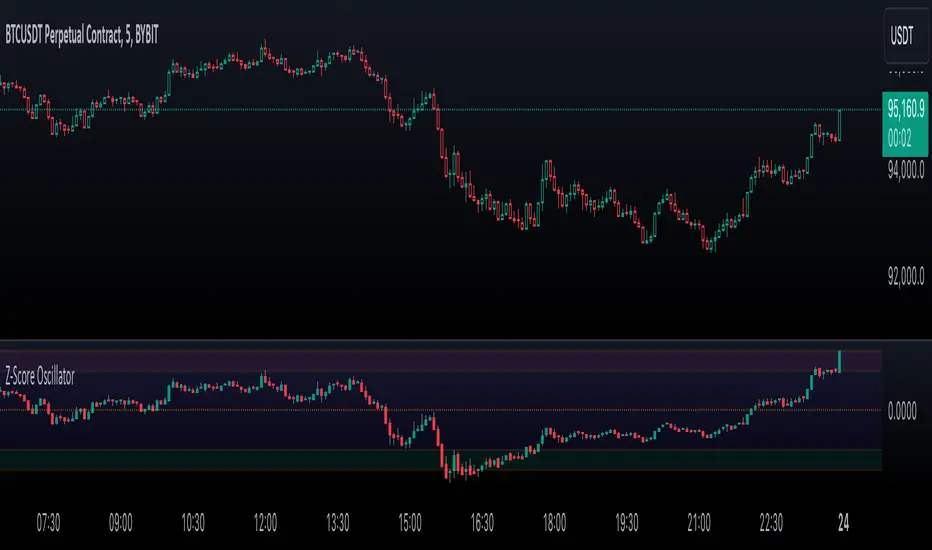
The Enhanced Price Z-Score Oscillator by tkarolak is a powerful tool that transforms raw price data into an easy-to-understand statistical visualization using Z-Score-derived candlesticks. Simply put, it shows how far prices stray from their average in terms of standard deviations (Z-Scores), helping traders identify when prices are unusually high (overbought) or unusually low (oversold).
The indicator’s default feature displays Z-Score Candlesticks, where each candle reflects the statistical “distance” of the open, high, low, and close prices from their average. This creates a visual map of market extremes and potential reversal points. For added flexibility, you can also switch to Z-Score line plots based on either Close prices or OHLC4 averages.
With clear threshold lines (±2σ and ±3σ) marking moderate and extreme price deviations, and color-coded zones to highlight overbought and oversold areas, the oscillator simplifies complex statistical concepts into actionable trading insights.
Mã nguồn mở
Theo đúng tinh thần TradingView, tác giả của tập lệnh này đã công bố nó dưới dạng mã nguồn mở, để các nhà giao dịch có thể xem xét và xác minh chức năng. Chúc mừng tác giả! Mặc dù bạn có thể sử dụng miễn phí, hãy nhớ rằng việc công bố lại mã phải tuân theo Nội quy.
Thông báo miễn trừ trách nhiệm
Thông tin và các ấn phẩm này không nhằm mục đích, và không cấu thành, lời khuyên hoặc khuyến nghị về tài chính, đầu tư, giao dịch hay các loại khác do TradingView cung cấp hoặc xác nhận. Đọc thêm tại Điều khoản Sử dụng.