PROTECTED SOURCE SCRIPT
Cập nhật ETHBTC Z-Score
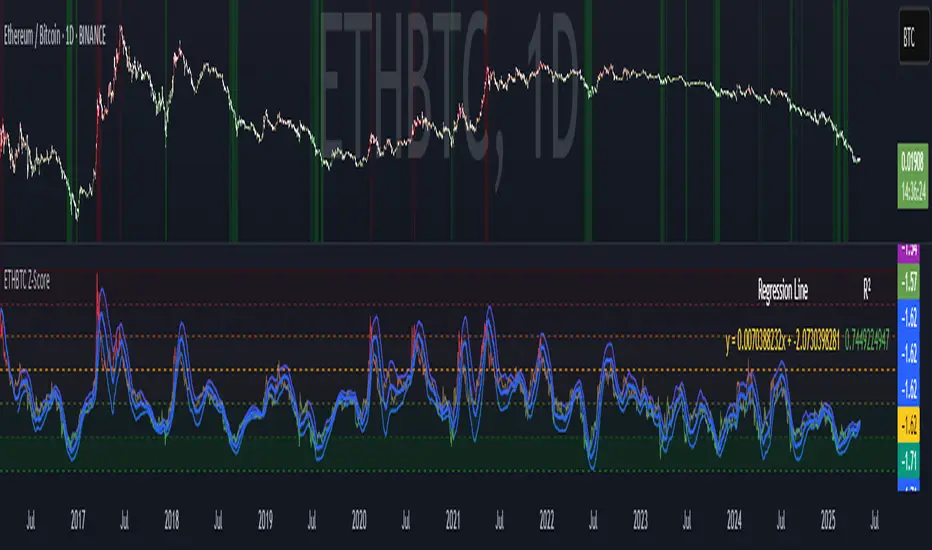
ETHBTC Z-Score Indicator
Key Features
Z-Score Calculation: Measures how far ETHBTC deviates from its mean over a user-defined period.
Linear Regression Line: Tracks the trend of the Z-score using least squares regression.
Standard Deviation Bands: Plots ±N standard deviations around the regression line to show expected Z-score range.
Dynamic Thresholds: Highlights overbought (e.g. Z > 1) and oversold (e.g. Z < -2) zones using color and background fill.
Visual & Table Display: Color-coded bars, horizontal level fills, and optional table showing regression formula and R².
Usage
Spot overbought/oversold extremes when Z-score crosses defined thresholds.
Use the regression line as a dynamic baseline and its bands as range boundaries.
Monitor R² to gauge how well the regression line fits the recent Z-score trend.
Example
Z > 1: ETHBTC may be overbought — potential caution or mean-reversion.
Z < -2: ETHBTC may be oversold — possible buying opportunity.
Z near regression line: Price is in line with recent trend.
Phát hành các Ghi chú
Updated to work on chart's timeframeMã được bảo vệ
Tập lệnh này được đăng dưới dạng mã nguồn đóng. Tuy nhiên, bạn có thể sử dụng tự do và không giới hạn – tìm hiểu thêm tại đây.
Thông báo miễn trừ trách nhiệm
Thông tin và các ấn phẩm này không nhằm mục đích, và không cấu thành, lời khuyên hoặc khuyến nghị về tài chính, đầu tư, giao dịch hay các loại khác do TradingView cung cấp hoặc xác nhận. Đọc thêm tại Điều khoản Sử dụng.
Mã được bảo vệ
Tập lệnh này được đăng dưới dạng mã nguồn đóng. Tuy nhiên, bạn có thể sử dụng tự do và không giới hạn – tìm hiểu thêm tại đây.
Thông báo miễn trừ trách nhiệm
Thông tin và các ấn phẩm này không nhằm mục đích, và không cấu thành, lời khuyên hoặc khuyến nghị về tài chính, đầu tư, giao dịch hay các loại khác do TradingView cung cấp hoặc xác nhận. Đọc thêm tại Điều khoản Sử dụng.