OPEN-SOURCE SCRIPT
Cập nhật Liquidity Indicator
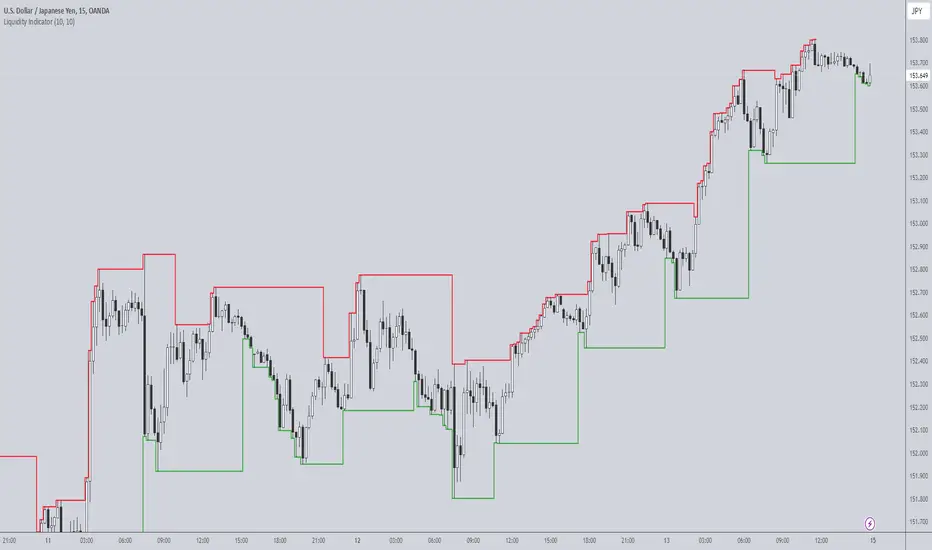
The Liquidity Indicator helps identify key price levels where liquidity may be concentrated by highlighting local highs and local lows on the chart. These levels are calculated using a lookback period to determine the highest and lowest points in the recent price action.
Local Highs: Displayed as red lines, these indicate recent peaks where price has experienced rejection or a possible reversal point.
Local Lows: Displayed as green lines, these represent recent troughs where price may find support or experience a bounce.
This indicator is useful for spotting potential areas of interest for price reversal or continuation, as high liquidity zones may lead to more significant price movements.
Key Features:
Adjustable lookback period to define the scope for identifying local highs and lows.
Continuous plotting without any time restrictions, providing real-time insights into liquidity conditions.
Alerts available for when a local high or local low is detected, enabling timely market analysis.
Use Case:
This indicator can be used in conjunction with other technical analysis tools or strategies to help identify significant price levels where liquidity could impact price action. It is suitable for both intraday and swing traders looking for key price zones where potential reversals or continuations might occur.
Phát hành các Ghi chú
The ability to create separate lookback periods for the upper and lower liquidity lines has been added.Phát hành các Ghi chú
The ability to create separate lookback periods for the upper and lower liquidity lines has been added.Mã nguồn mở
Theo đúng tinh thần TradingView, tác giả của tập lệnh này đã công bố nó dưới dạng mã nguồn mở, để các nhà giao dịch có thể xem xét và xác minh chức năng. Chúc mừng tác giả! Mặc dù bạn có thể sử dụng miễn phí, hãy nhớ rằng việc công bố lại mã phải tuân theo Nội quy.
Thông báo miễn trừ trách nhiệm
Thông tin và các ấn phẩm này không nhằm mục đích, và không cấu thành, lời khuyên hoặc khuyến nghị về tài chính, đầu tư, giao dịch hay các loại khác do TradingView cung cấp hoặc xác nhận. Đọc thêm tại Điều khoản Sử dụng.
Mã nguồn mở
Theo đúng tinh thần TradingView, tác giả của tập lệnh này đã công bố nó dưới dạng mã nguồn mở, để các nhà giao dịch có thể xem xét và xác minh chức năng. Chúc mừng tác giả! Mặc dù bạn có thể sử dụng miễn phí, hãy nhớ rằng việc công bố lại mã phải tuân theo Nội quy.
Thông báo miễn trừ trách nhiệm
Thông tin và các ấn phẩm này không nhằm mục đích, và không cấu thành, lời khuyên hoặc khuyến nghị về tài chính, đầu tư, giao dịch hay các loại khác do TradingView cung cấp hoặc xác nhận. Đọc thêm tại Điều khoản Sử dụng.