OPEN-SOURCE SCRIPT
Cập nhật Ultra Liquidity Heatmap
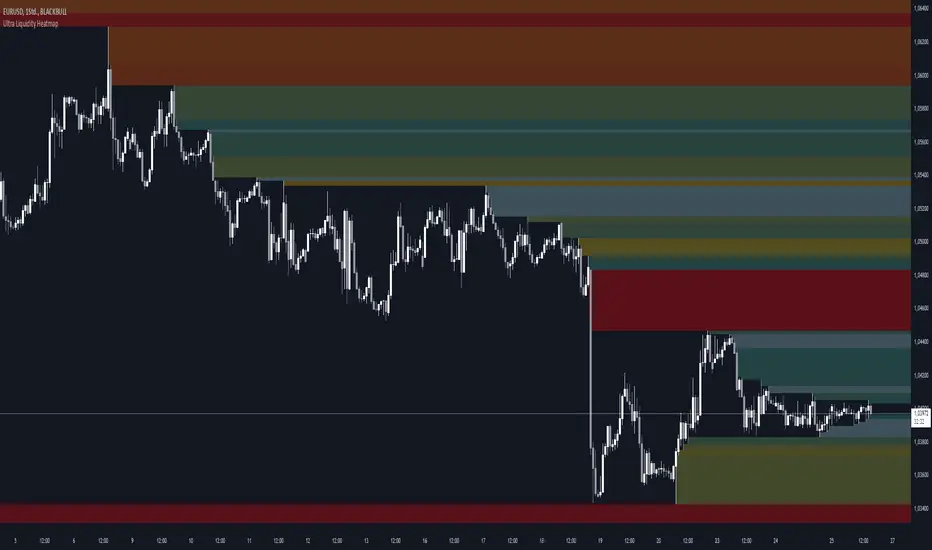
The Ultra Liquditiy Heatmap is a unique visualization tool designed to map out areas of high liquidity on the chart using a dynamic heatmap, helping traders identify significant price zones effectively.
Introduction
The Ultra Liquidity Heatmap is an advanced indicator for visualizing key liquidity areas on your chart. Whether you're a scalper, swing trader, or long-term investor, understanding liquidity dynamics can offer a powerful edge in market analysis. This tool provides a straightforward visual representation of these zones directly on your chart.
Detailed Description
The Ultra Liquidity Heatmap identifies high and low liquidity zones by dynamically marking price ranges with heatmap-like boxes.
.........
.........
The Ultra Liquidity Heatmap bridges the gap between raw price data and actionable market insight. Add it to your toolbox and elevate your trading strategy today!
Introduction
The Ultra Liquidity Heatmap is an advanced indicator for visualizing key liquidity areas on your chart. Whether you're a scalper, swing trader, or long-term investor, understanding liquidity dynamics can offer a powerful edge in market analysis. This tool provides a straightforward visual representation of these zones directly on your chart.
Detailed Description
The Ultra Liquidity Heatmap identifies high and low liquidity zones by dynamically marking price ranges with heatmap-like boxes.
.........
- Dynamic Zone Creation
For low liquidity zones, the script draws boxes extending from the low to the high of the bar. If the price breaks below a previously defined zone, that box is removed.
Similarly, for high liquidity zones, the script tracks and highlights price ranges above the current high, removing boxes if the price exceeds the zone.
..... - Customizable Visuals
Users can adjust the transparency and color of the heatmap, tailoring the visualization to their preference.
..... - Real-Time Updates
The indicator constantly updates as new price data comes in, ensuring that the heatmap reflects the most current liquidity zones.
..... - Efficiency and Scalability
The script uses optimized arrays and a maximum box limit of 500 to ensure smooth performance even on higher timeframes or during high-volatility periods.
.........
The Ultra Liquidity Heatmap bridges the gap between raw price data and actionable market insight. Add it to your toolbox and elevate your trading strategy today!
Phát hành các Ghi chú
update version 2added volume coloring and an option to select where the boxes drawn from
Phát hành các Ghi chú
rewrote the script beacause of some issues while deleting and drawing boxesadded gradient coloring
removed version 1 (if you need it, PN me)
Mã nguồn mở
Theo đúng tinh thần TradingView, tác giả của tập lệnh này đã công bố nó dưới dạng mã nguồn mở, để các nhà giao dịch có thể xem xét và xác minh chức năng. Chúc mừng tác giả! Mặc dù bạn có thể sử dụng miễn phí, hãy nhớ rằng việc công bố lại mã phải tuân theo Nội quy.
Thông báo miễn trừ trách nhiệm
Thông tin và các ấn phẩm này không nhằm mục đích, và không cấu thành, lời khuyên hoặc khuyến nghị về tài chính, đầu tư, giao dịch hay các loại khác do TradingView cung cấp hoặc xác nhận. Đọc thêm tại Điều khoản Sử dụng.