OPEN-SOURCE SCRIPT
Cập nhật Beyond Insights Indicator
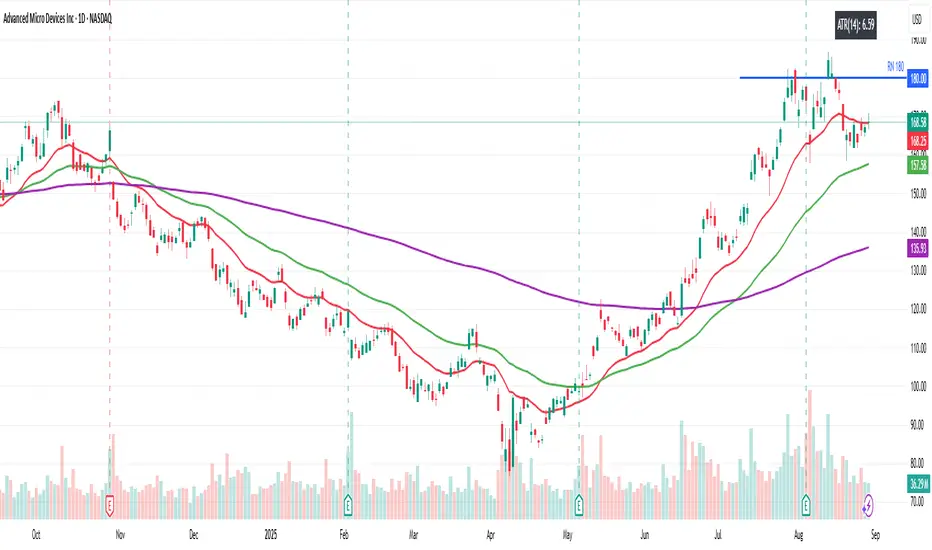
The Beyond Insights Indicator is a multi-timeframe overlay tool designed for TradingView that displays key Exponential Moving Averages (EMAs) and volatility insights to support various trading strategies. It intelligently adapts its display based on the current chart timeframe to reduce clutter and enhance relevance. Specifically, it shows EMA 6, 18, and 50 when viewing intraday timeframes.
In addition to EMAs, the indicator includes an ATR (Average True Range) calculation with a default length of 14, offering insight into market volatility.
In addition to EMAs, the indicator includes an ATR (Average True Range) calculation with a default length of 14, offering insight into market volatility.
Phát hành các Ghi chú
Purpose of the Script:When you switch between Monthly/Weekly/Daily charts, you only see the corresponding EMA20/50/200 lines (styled slightly differently to indicate the timeframe).
When you drop to any intraday chart (1 min, 5 min, 1 hour…), you instead see faster EMAs (6, 18, 50) suited to that shorter timeframe.
No matter which timeframe you’re on, there’s always a small overlay table in the top-right showing the current 14-period ATR reading.
The ATR reading in the corner gives you an immediate sense of current volatility without opening a separate indicator pane.
Phát hành các Ghi chú
Updated ATR to Two Decimal.Make the ATR more visible (Shifted to left)
Mã nguồn mở
Theo đúng tinh thần TradingView, tác giả của tập lệnh này đã công bố nó dưới dạng mã nguồn mở, để các nhà giao dịch có thể xem xét và xác minh chức năng. Chúc mừng tác giả! Mặc dù bạn có thể sử dụng miễn phí, hãy nhớ rằng việc công bố lại mã phải tuân theo Nội quy.
Thông báo miễn trừ trách nhiệm
Thông tin và các ấn phẩm này không nhằm mục đích, và không cấu thành, lời khuyên hoặc khuyến nghị về tài chính, đầu tư, giao dịch hay các loại khác do TradingView cung cấp hoặc xác nhận. Đọc thêm tại Điều khoản Sử dụng.