OPEN-SOURCE SCRIPT
Cập nhật Mean Reversion Dots
Markets tend to mean revert. This indicator plots a moving average from a higher time frame (type of MA and length selectable by the user). It then calculates standard deviations in two dimensions:
- Standard deviation of move of price away from this moving average
- Standard deviations of number of bars spent in this extended range
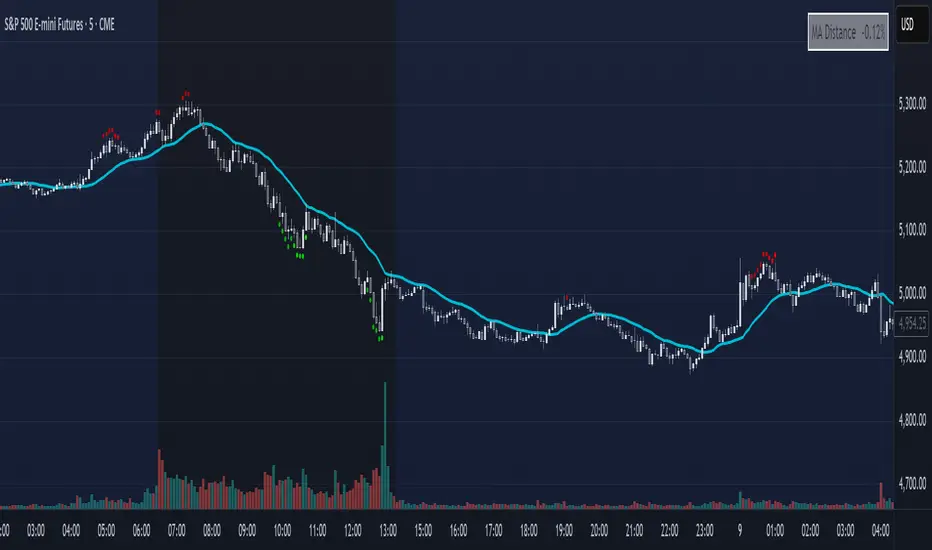
The indicator plots a table in the upper right corner with the % of distance of price from the moving average. It then plots 'mean reversion dots' once price has been 1 or more standard deviations away from the moving average for one or more standard deviations number of bars. The dots change color, becoming more intense, the longer the move persists. Optionally, the user can display the standard deviations in movement away from the moving average as channels, and the user can also select which levels of moves they want to see. Opting to see only more extreme moves will result in fewer signals, but signals that are more likely to imminently result in mean reversion back to the moving average.
In my opinion, this indicator is more likely to be useful for indices, futures, commodities, and select larger cap names.
Combinations I have found that work well for SPX are plotting the 30min 21ema on a 5min chart and the daily 21ema on an hourly chart.
In many cases, once mean reversion dots for an extreme enough move (level 1.3 or 2.2 and above) begin to appear, a trade may be initiated from a support/resistance level. A safer way to use these signals is to consider them as a 'heads up' that the move is overextended, and then look for a buy/sell signal from another indicator to initiate a position.
Note: I borrowed the code for the higher timeframe MA from the below indicator. I added the ability to select type of MA.
- Standard deviation of move of price away from this moving average
- Standard deviations of number of bars spent in this extended range
The indicator plots a table in the upper right corner with the % of distance of price from the moving average. It then plots 'mean reversion dots' once price has been 1 or more standard deviations away from the moving average for one or more standard deviations number of bars. The dots change color, becoming more intense, the longer the move persists. Optionally, the user can display the standard deviations in movement away from the moving average as channels, and the user can also select which levels of moves they want to see. Opting to see only more extreme moves will result in fewer signals, but signals that are more likely to imminently result in mean reversion back to the moving average.
In my opinion, this indicator is more likely to be useful for indices, futures, commodities, and select larger cap names.
Combinations I have found that work well for SPX are plotting the 30min 21ema on a 5min chart and the daily 21ema on an hourly chart.
In many cases, once mean reversion dots for an extreme enough move (level 1.3 or 2.2 and above) begin to appear, a trade may be initiated from a support/resistance level. A safer way to use these signals is to consider them as a 'heads up' that the move is overextended, and then look for a buy/sell signal from another indicator to initiate a position.
Note: I borrowed the code for the higher timeframe MA from the below indicator. I added the ability to select type of MA.
Phát hành các Ghi chú
A long overdue update to this indicator, this update does some code cleanup as well as makes the following minor but helpful changes.- Default source value is now 'open' rather than close. This avoids the possibility of repainting when a higher timeframe rather than the chart moving average is used. If using on the chart timeframe.
- Turns off by default some of the lower level dots which are lower probability to result in mean reversion.
- Adds options for alerts on first reversion dot, either of a specified degree, or whatever the lowest threshold the user has enabled.
Mã nguồn mở
Theo đúng tinh thần TradingView, tác giả của tập lệnh này đã công bố nó dưới dạng mã nguồn mở, để các nhà giao dịch có thể xem xét và xác minh chức năng. Chúc mừng tác giả! Mặc dù bạn có thể sử dụng miễn phí, hãy nhớ rằng việc công bố lại mã phải tuân theo Nội quy.
Thông báo miễn trừ trách nhiệm
Thông tin và các ấn phẩm này không nhằm mục đích, và không cấu thành, lời khuyên hoặc khuyến nghị về tài chính, đầu tư, giao dịch hay các loại khác do TradingView cung cấp hoặc xác nhận. Đọc thêm tại Điều khoản Sử dụng.