OPEN-SOURCE SCRIPT
Monthly Expected Move (IV + Realized)
What it does
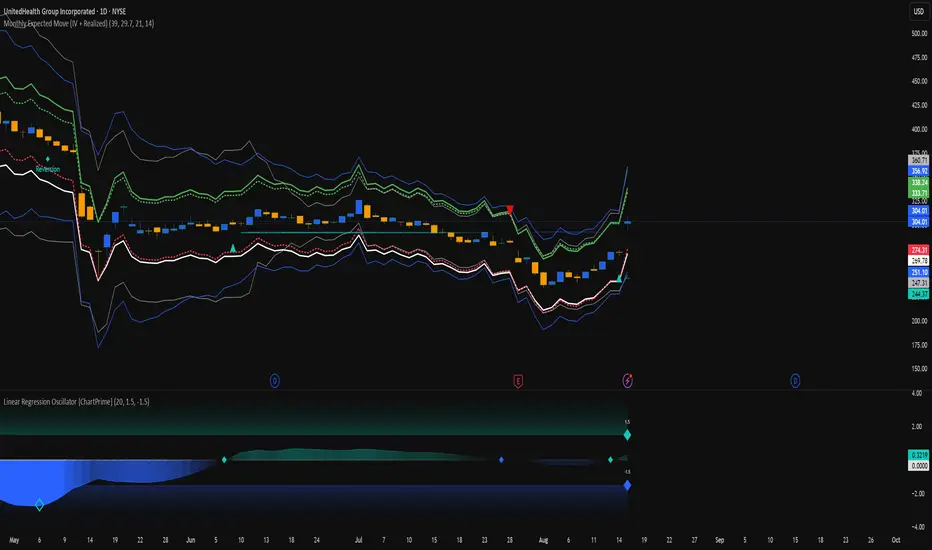
Overlays 1-month expected move bands on price using both forward-looking options data and backward-looking realized movement:
IV30 band — from your pasted 30-day implied vol (%)
Straddle band — from your pasted ATM ~30-DTE call+put total
HV band — from Historical Volatility computed on-chart
ATR band — from ATR% extrapolated to ~1 trading month
Use it to quickly answer: “How much could this stock move in ~1 month?” and “Is the market now pricing more/less movement than we’ve actually been getting?”
Inputs (quick)
Implied (forward-looking)
Use IV30 (%) — paste annualized IV30 from your options platform.
Use ATM 30-DTE Straddle — paste Call+Put total (per share) at the ATM strike, ~30 DTE.
Realized (backward-looking)
HV lookback (days) — default 21 (≈1 trading month).
ATR length — default 14.
Note: TradingView can’t fetch option data automatically. Paste the IV30 % or the straddle total you read from your broker (use Mark/mid prices).
How it’s calculated
IV band (±%) = IV30 × √(21/252) (annualized → ~1-month).
Straddle band (±%) = (ATM Call + Put) / Spot to that expiry (≈30 DTE).
HV band (±%) = stdev(log returns, N) × √252 × √(21/252).
ATR band (±%) = (ATR(len)/Close) × √21.
All bands are plotted as upper/lower envelopes around price, plus an on-chart readout of each ±% for quick scanning.
How to use it (at a glance)
IV/Straddle bands wider than HV/ATR → market expects bigger movement than recent actuals (possible catalyst/expansion).
All bands narrow → likely a low-mover; look elsewhere if you want action.
HV > IV → realized swings exceed current pricing (mean-reversion or vol bleed often follows).
Pro tips
For ATM straddle: pick the expiry closest to ~30 DTE, use the ATM strike (closest to spot), and add Call Mark + Put Mark (per share). If the exact ATM strike isn’t quoted, average the two neighboring strikes.
The simple straddle/spot heuristic can read slightly below the IV-derived 1σ; that’s normal.
Keep the chart on daily timeframe—the math assumes trading-day conventions (~252/yr, ~21/mo).
Mã nguồn mở
Theo đúng tinh thần TradingView, tác giả của tập lệnh này đã công bố nó dưới dạng mã nguồn mở, để các nhà giao dịch có thể xem xét và xác minh chức năng. Chúc mừng tác giả! Mặc dù bạn có thể sử dụng miễn phí, hãy nhớ rằng việc công bố lại mã phải tuân theo Nội quy.
Thông báo miễn trừ trách nhiệm
Thông tin và các ấn phẩm này không nhằm mục đích, và không cấu thành, lời khuyên hoặc khuyến nghị về tài chính, đầu tư, giao dịch hay các loại khác do TradingView cung cấp hoặc xác nhận. Đọc thêm tại Điều khoản Sử dụng.