PROTECTED SOURCE SCRIPT
Life Strand
A visual representation of 25, 50, 100, or 200 moving averages and their position relative to price action.
Reading this Indicator:
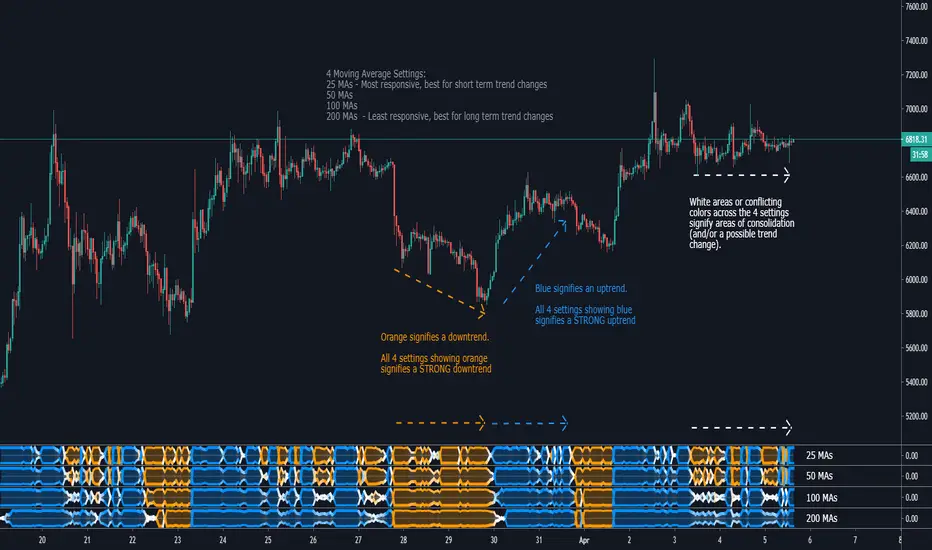
Blue represents that the majority of MAs are below price action, indicating a bullish trend. The wider the Strand, the stronger the trend. All 4 Settings showing blue indicate a strong bullish trend.
Orange represents that the majority of MAs are above price action, indicating a bearish trend. The wider the Strand, the stronger the trend. All 4 Settings showing orange indicate a strong bearish trend.
White areas signify some MAs are above while others are below price action, indicating periods of consolidation or trend change.
The 25 MA setting is most responsive to PA and shows change of trends quickly. The 200 MA setting is the least responsive but gives a solid look at the long term trend and ignores the ups and downs in a longer trend.
Currently Supported MAs:
Simple Moving Average (SMA)
Exponential Moving Average (EMA)
RSI Moving Average (RMA)
Weighted Moving Average (WMA)
Volume Weighted Moving Average (VWMA)
Jurik Moving Average (JMA)
Trading Strategy:
I prefer to have all 4 Life Strands open (25, 50, 100, 200) and look for confluence of all 4 for confirmation of PA direction. All 4 are orange for 2-4 candles, strong indication of bearish movement. Same can be said for blue. When the 4 settings have conflicting colors (ie 2 are blue, 2 are orange), that PA becomes a no trade zone for me. Confirmation is key, as is with any indicator.

Reading this Indicator:
Blue represents that the majority of MAs are below price action, indicating a bullish trend. The wider the Strand, the stronger the trend. All 4 Settings showing blue indicate a strong bullish trend.
Orange represents that the majority of MAs are above price action, indicating a bearish trend. The wider the Strand, the stronger the trend. All 4 Settings showing orange indicate a strong bearish trend.
White areas signify some MAs are above while others are below price action, indicating periods of consolidation or trend change.
The 25 MA setting is most responsive to PA and shows change of trends quickly. The 200 MA setting is the least responsive but gives a solid look at the long term trend and ignores the ups and downs in a longer trend.
Currently Supported MAs:
Simple Moving Average (SMA)
Exponential Moving Average (EMA)
RSI Moving Average (RMA)
Weighted Moving Average (WMA)
Volume Weighted Moving Average (VWMA)
Jurik Moving Average (JMA)
Trading Strategy:
I prefer to have all 4 Life Strands open (25, 50, 100, 200) and look for confluence of all 4 for confirmation of PA direction. All 4 are orange for 2-4 candles, strong indication of bearish movement. Same can be said for blue. When the 4 settings have conflicting colors (ie 2 are blue, 2 are orange), that PA becomes a no trade zone for me. Confirmation is key, as is with any indicator.
Mã được bảo vệ
Tập lệnh này được đăng dưới dạng mã nguồn đóng. Tuy nhiên, bạn có thể sử dụng tự do và không giới hạn – tìm hiểu thêm tại đây.
Thông báo miễn trừ trách nhiệm
Thông tin và các ấn phẩm này không nhằm mục đích, và không cấu thành, lời khuyên hoặc khuyến nghị về tài chính, đầu tư, giao dịch hay các loại khác do TradingView cung cấp hoặc xác nhận. Đọc thêm tại Điều khoản Sử dụng.