PROTECTED SOURCE SCRIPT
[Futures OI vs Price Change] (% Change)
╔═══════════════════ RUBIXCUBE ══════════════════════╗
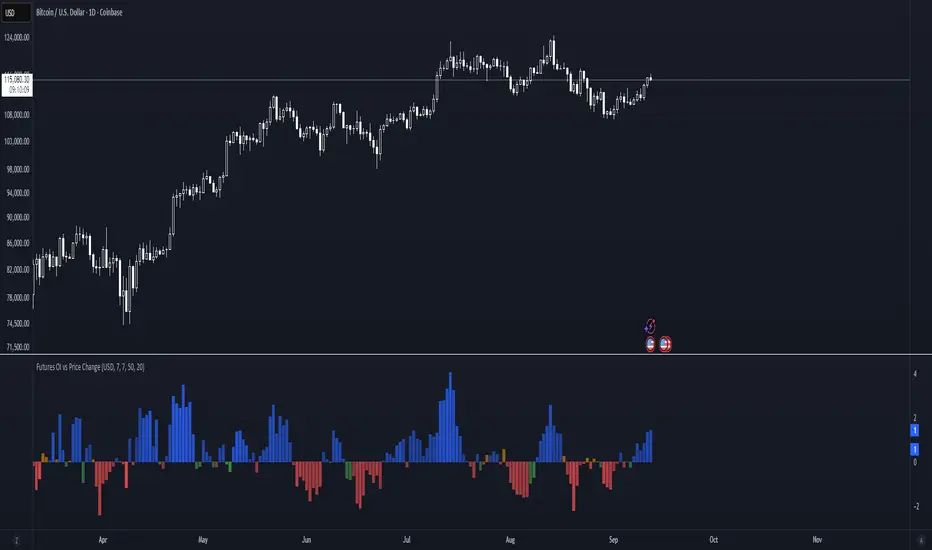
This indicator analyses the relationship between Open Interest percentage changes and price percentage changes in futures markets. Inspired by Checkonchain's market structure analysis, it displays this data as coloured column bars to identify different market conditions.
What This Indicator Shows
The indicator plots Open Interest percentage change as column bars, with colours representing four market regimes:
- Blue (Leveraged Rally): OI increases + Price increases (New leveraged long positions)
- Green (Spot Rally): OI decreases + Price increases (Organic buying or short covering)
- Orange (Leveraged Sell-Off): OI increases + Price decreases (New short positions or long liquidations)
- Red (Deleveraging Sell-Off): OI decreases + Price decreases (Position unwinding)
Bar transparency changes based on price movement magnitude. Larger price changes result in more solid bars, while smaller moves appear more transparent.
Data Sources
Aggregated Open Interest data from multiple exchanges:
- Binance USDT, USD & BUSD Perpetuals
- BitMEX USD & USDT Perpetuals
- Kraken USD Perpetuals
Settings
- OI % Change SMA: Smoothing period for Open Interest changes (Default: 7)
- Price % Change SMA: Smoothing period for price changes (Default: 7)
- Base Transparency: Baseline transparency level (0-100)
- Transparency Sensitivity: How much price change affects bar transparency
- Exchange Toggles: Enable/disable individual exchange data
Usage
This indicator helps identify market structure by showing whether price moves are accompanied by increasing or decreasing leveraged positions. Blue and orange bars indicate new leverage entering the market, while green and red bars suggest position reduction or organic spot activity.
╚═════════════════════════════════════════════════╝
Mã được bảo vệ
Tập lệnh này được đăng dưới dạng mã nguồn đóng. Tuy nhiên, bạn có thể sử dụng tự do và không giới hạn – tìm hiểu thêm tại đây.
Thông báo miễn trừ trách nhiệm
Thông tin và các ấn phẩm này không nhằm mục đích, và không cấu thành, lời khuyên hoặc khuyến nghị về tài chính, đầu tư, giao dịch hay các loại khác do TradingView cung cấp hoặc xác nhận. Đọc thêm tại Điều khoản Sử dụng.