OPEN-SOURCE SCRIPT
Cập nhật Gap SMA
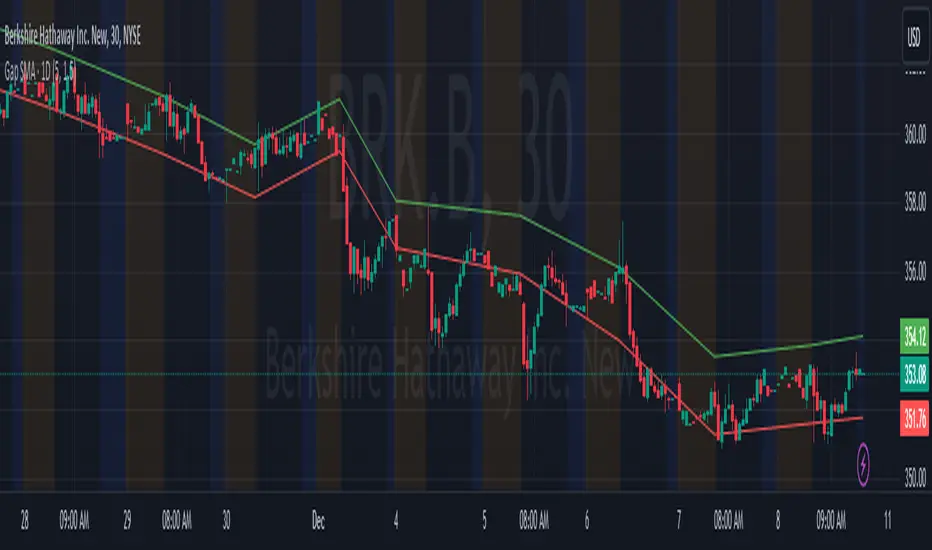
Gap SMA Indicator - Analyzing Price Gaps with Moving Averages
Description:
The Gap SMA (Simple Moving Average) indicator is a powerful tool designed to analyze price gaps, a phenomenon occurring when the market opens significantly higher or lower than the previous session's close. These gaps often signify abrupt shifts in market sentiment, driven by fundamental news, earnings reports, or overnight geopolitical events.
This indicator calculates and visualizes the average gap-up and gap-down based on historical data, aiding traders in identifying potential support or resistance levels driven by gap behavior.
What is a Gap?
In financial markets, a gap occurs when there is a notable difference (upward or downward) between the previous session's close and the current session's open. Gaps can be categorized as gap-ups (when the current open is higher than the previous close) or gap-downs (when the current open is lower than the previous close).
Key Features:
User-Defined Parameters: Adjust the number of gaps considered and a multiplier factor for precise customization.
Average Gap Visualization: Plotting lines representing the moving average of gap-ups and gap-downs.
Alert System: Alerts notify traders when the close price crosses above/below the average gap lines, offering potential entry or exit signals.
This tool is particularly useful for swing traders and investors interested in understanding historical gap patterns and integrating this information into their decision-making process. It can assist in determining potential stop-loss levels, defining entry or exit points, and gauging market sentiment based on gap behavior.
Feel free to experiment with various settings and timeframes to suit your trading strategy and risk tolerance. Your feedback and suggestions for further enhancements are highly appreciated!
Phát hành các Ghi chú
The "Gap SMA" indicator, designed by jdavenport416, is a powerful tool that detects and analyzes gaps in price action, offering insights into potential trading opportunities based on these gaps. This indicator focuses on identifying the magnitude of price gaps and their subsequent impact on price movements by utilizing Simple Moving Averages (SMA).Key features of the "Gap SMA" indicator include:
- Timeframe Flexibility: This indicator can be applied across various timeframes, providing traders with the flexibility to use it on different chart setups without specific timeframe restrictions (timeframe="").
- Gap Consideration and Multiplier Control: It considers a user-defined number of recent gaps (n) and allows adjustment of a multiplier to quantify the significance of these gaps on price movements (multiplier).
The "Gap SMA" indicator calculates the average gap size for upward and downward price gaps, then plots the Close price in relation to these gap averages. The plotted lines, "Close + Avg Gap Up" (in green) and "Close - Avg Gap Down" (in red), serve as reference points, indicating potential levels where the Close price might encounter resistance or support based on historical gap behavior.
Additionally, the indicator is equipped with alert conditions that notify traders when the Close price crosses above the 'Close + Avg Gap Up' line or below the 'Close - Avg Gap Down' line, helping traders identify potential entry or exit points.
Traders are encouraged to use the "Gap SMA" indicator in conjunction with other technical analysis tools and trading strategies for comprehensive decision-making in various market conditions.
Please note that while this indicator can provide valuable insights into gap dynamics and potential price movements, it's advisable to combine it with additional analysis and risk management strategies for effective trading decisions.
Mã nguồn mở
Theo đúng tinh thần TradingView, tác giả của tập lệnh này đã công bố nó dưới dạng mã nguồn mở, để các nhà giao dịch có thể xem xét và xác minh chức năng. Chúc mừng tác giả! Mặc dù bạn có thể sử dụng miễn phí, hãy nhớ rằng việc công bố lại mã phải tuân theo Nội quy.
Thông báo miễn trừ trách nhiệm
Thông tin và các ấn phẩm này không nhằm mục đích, và không cấu thành, lời khuyên hoặc khuyến nghị về tài chính, đầu tư, giao dịch hay các loại khác do TradingView cung cấp hoặc xác nhận. Đọc thêm tại Điều khoản Sử dụng.