PROTECTED SOURCE SCRIPT
Price Grid (Base/Step/Levels)
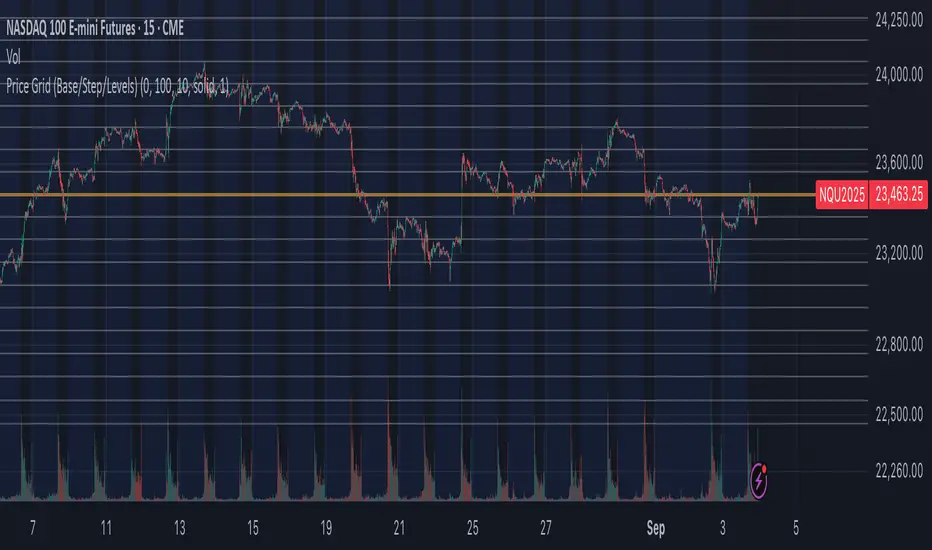
Price Grid (Base/Step/Levels) is a simple yet powerful tool for visual traders. It automatically draws a customizable grid of horizontal price levels on your chart.
You choose a base price, a grid step size, and the number of levels to display above and below. The indicator then plots evenly spaced lines around the base, helping you:
Spot round-number zones and psychological levels
Plan entries, exits, and stop-loss placements
Visualize support/resistance clusters
Build grid or ladder trading strategies
The base line is highlighted so you always know your anchor level, while the other levels are styled separately for clarity.
⚙️ Inputs
Base price → anchor level (set 0 to use current close price)
Grid step → distance between levels
Number of levels → lines drawn above & below base
Line style / width / colors → full customization
✅ Notes
Works on any market and timeframe
Automatically respects the symbol’s minimum tick size
Lightweight & non-repainting
Mã được bảo vệ
Tập lệnh này được đăng dưới dạng mã nguồn đóng. Tuy nhiên, bạn có thể sử dụng tự do và không giới hạn – tìm hiểu thêm tại đây.
Thông báo miễn trừ trách nhiệm
Thông tin và các ấn phẩm này không nhằm mục đích, và không cấu thành, lời khuyên hoặc khuyến nghị về tài chính, đầu tư, giao dịch hay các loại khác do TradingView cung cấp hoặc xác nhận. Đọc thêm tại Điều khoản Sử dụng.