OPEN-SOURCE SCRIPT
PheeTrades - Value Area Levels (VAH / VAL / POC Visualizer)

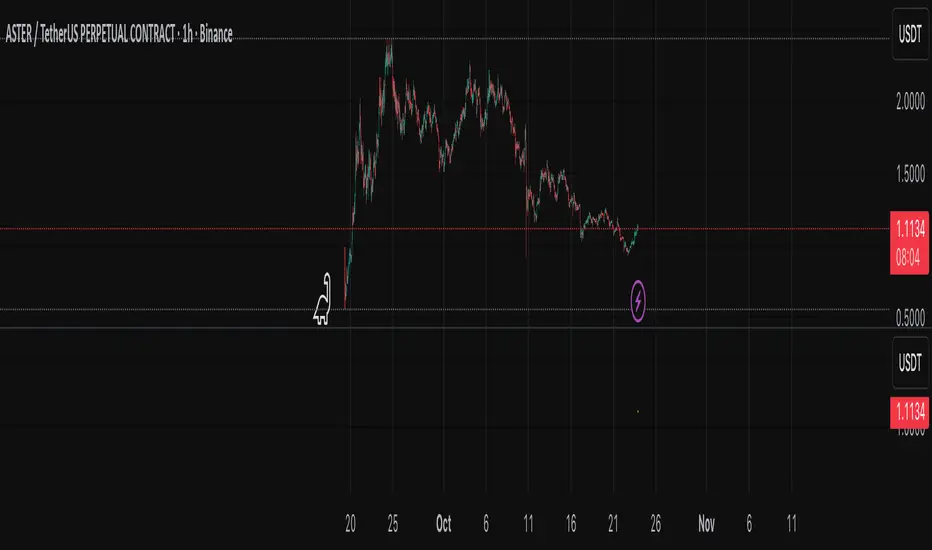
This script helps traders quickly visualize key Volume Profile–style levels such as Value Area High (VAH), Value Area Low (VAL), and Point of Control (POC) using recent price and volume data.
While TradingView’s built-in Volume Profile tool is great for manual analysis, this indicator automatically calculates and plots approximate value zones directly on your chart — ideal for traders who want to identify high-probability support and resistance areas without drawing a fixed range every time.
Features:
Calculates short-term VAH, VAL, and POC based on a user-defined lookback period.
Plots color-coded levels for quick visual reference.
Helps identify “fair value” zones where most trading activity occurred.
Useful for detecting breakout or mean-reversion opportunities around value extremes.
How to use:
Apply the script to any chart and set your preferred lookback period.
VAH (red line): potential upper resistance or overbought zone.
VAL (green line): potential lower support or accumulation zone.
POC (orange line): price level with the highest traded activity — often a magnet for price.
Note:
This is a simplified Value Area model meant for educational and analytical use. It does not replace TradingView’s official Volume Profile or broker-level volume distribution data.
Mã nguồn mở
Theo đúng tinh thần TradingView, tác giả của tập lệnh này đã công bố nó dưới dạng mã nguồn mở, để các nhà giao dịch có thể xem xét và xác minh chức năng. Chúc mừng tác giả! Mặc dù bạn có thể sử dụng miễn phí, hãy nhớ rằng việc công bố lại mã phải tuân theo Nội quy.
Thông báo miễn trừ trách nhiệm
Thông tin và các ấn phẩm này không nhằm mục đích, và không cấu thành, lời khuyên hoặc khuyến nghị về tài chính, đầu tư, giao dịch hay các loại khác do TradingView cung cấp hoặc xác nhận. Đọc thêm tại Điều khoản Sử dụng.