OPEN-SOURCE SCRIPT
Cập nhật Yesterday's Levels with 50% wick and Equilibrium
## Script Description
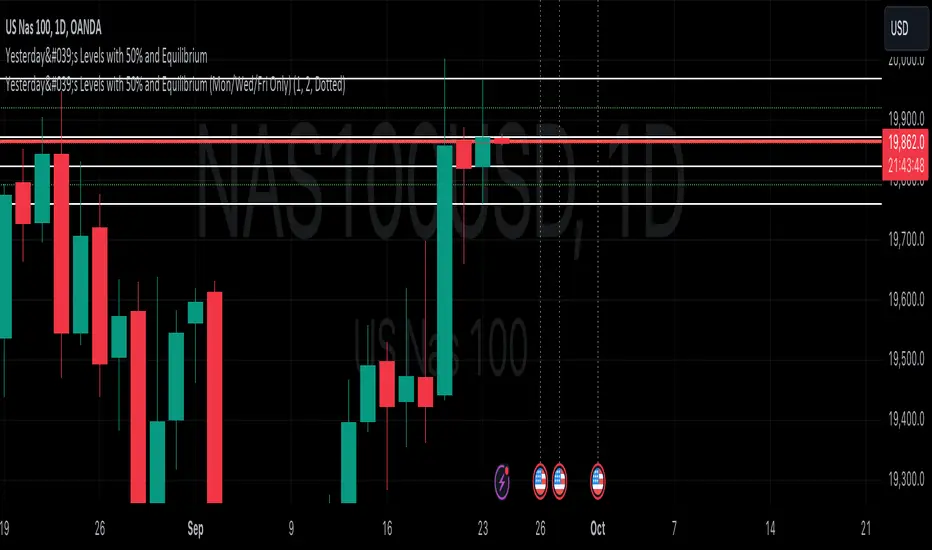
This Pine Script indicator highlights key levels from the previous day’s daily candle on any timeframe chart. It focuses exclusively on marking the following:
1. **Previous Day’s High, Low, Open, and Close**:
- Horizontal lines are drawn to indicate the previous day's high, low, open, and close prices.
- These lines are white and extend across the chart.
2. **50% of Candle Wicks**:
- If the previous day’s candle has wicks, two additional lines mark 50% of the top wick and 50% of the bottom wick.
- These lines are green and dotted, representing half the wick’s height.
3. **Equilibrium (50% of the Full Candle)**:
- A horizontal red line marks the midpoint (equilibrium) of the entire previous day’s candle, from high to low.
- This line is thicker than the others to emphasize the equilibrium level.
The script works by focusing only on the previous day’s daily candle, ensuring that it doesn’t plot lines for any older candles. These levels are visible on all timeframes.
Phát hành các Ghi chú
# Indicator: "Yesterday's Levels with 50% and Equilibrium"This indicator helps traders by automatically plotting key levels from the previous day's candle on their charts. It provides a clear visual reference to important price levels that can be used for making trading decisions on any timeframe. The following key features are included:
### 1. Previous Day's High, Low, Open, and Close:
- Horizontal lines mark the high, low, open, and close of the previous day's candle, providing quick visual access to these key levels.
- These levels are drawn in white and extend across all future bars, making them easy to see no matter which timeframe you're viewing.
### 2. Equilibrium Level:
- A red, thick horizontal line marks the "equilibrium" or 50% level of the previous day's entire range (from high to low). This level is often used by traders to gauge potential reversal or continuation zones.
### 3. 50% Wick Levels:
- Green dotted lines represent the 50% level of the upper and lower wicks of the previous day's candle. These lines can help identify potential reaction areas within the day's price action.
The indicator is designed to work on all timeframes but only calculates levels based on the previous day’s candle from the daily timeframe. This makes it particularly useful for intraday and swing traders who want to keep track of the prior day's price action.
Phát hành các Ghi chú
Marks the previous day high, low, open and close of a candle. Tha script runs on Monday, Tuesday and Fridays. Mã nguồn mở
Theo đúng tinh thần TradingView, tác giả của tập lệnh này đã công bố nó dưới dạng mã nguồn mở, để các nhà giao dịch có thể xem xét và xác minh chức năng. Chúc mừng tác giả! Mặc dù bạn có thể sử dụng miễn phí, hãy nhớ rằng việc công bố lại mã phải tuân theo Nội quy.
Thông báo miễn trừ trách nhiệm
Thông tin và các ấn phẩm này không nhằm mục đích, và không cấu thành, lời khuyên hoặc khuyến nghị về tài chính, đầu tư, giao dịch hay các loại khác do TradingView cung cấp hoặc xác nhận. Đọc thêm tại Điều khoản Sử dụng.
Mã nguồn mở
Theo đúng tinh thần TradingView, tác giả của tập lệnh này đã công bố nó dưới dạng mã nguồn mở, để các nhà giao dịch có thể xem xét và xác minh chức năng. Chúc mừng tác giả! Mặc dù bạn có thể sử dụng miễn phí, hãy nhớ rằng việc công bố lại mã phải tuân theo Nội quy.
Thông báo miễn trừ trách nhiệm
Thông tin và các ấn phẩm này không nhằm mục đích, và không cấu thành, lời khuyên hoặc khuyến nghị về tài chính, đầu tư, giao dịch hay các loại khác do TradingView cung cấp hoặc xác nhận. Đọc thêm tại Điều khoản Sử dụng.