OPEN-SOURCE SCRIPT
Cập nhật Asymmetric volatility
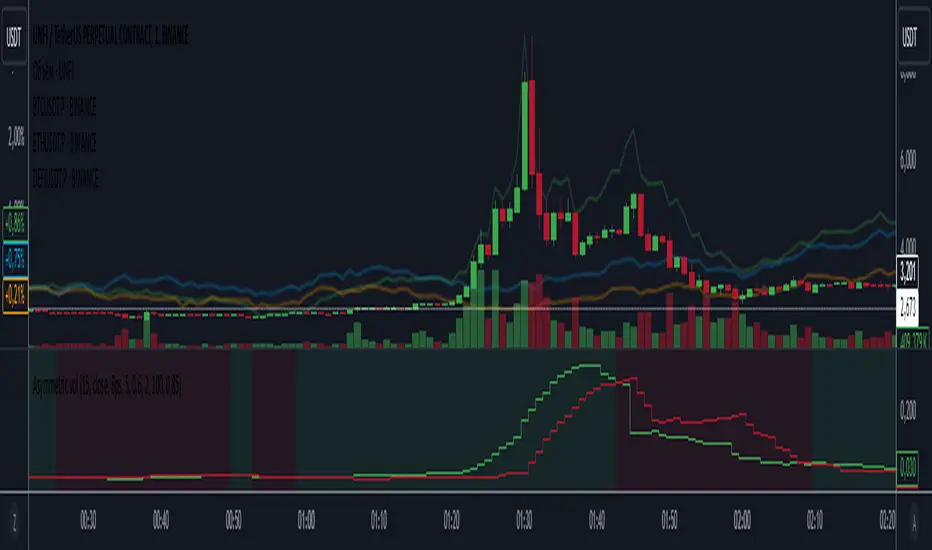
The "Asymmetric Volatility" indicator is designed to visualize the differences in volatility between upward and downward price movements of a selected instrument. It operates on the principle of analyzing price movements over a specified time period, with particular focus on the symmetrical evaluation of both price rises and falls.
User Parameters:
- Length: This parameter specifies the number of bars (candles) used to calculate the average volatility. The larger the value, the longer the time period, and the smoother the volatility data will be.
- Source: This represents the input data for the indicator calculations. By default, the close value of each bar is used, but the user can choose another data source (such as open, high, low, or any custom value).
Operational Algorithm:
1. Movement Calculation:
- UpMoves: Computed as the positive difference between the current bar value and the previous bar value, if it is greater than zero.
- DownMoves: Computed as the positive difference between the previous bar value and the current bar value, if it is greater than zero.
2. Volatility Calculation:
- UpVolatility: This is the arithmetic mean of the UpMoves values over the specified period.
- DownVolatility: This is the arithmetic mean of the DownMoves values over the specified period.
3. Graphical Representation:
- The indicator displays two plots: upward and downward volatility, represented by green and red lines, respectively.
- The background color changes based on which volatility is dominant: a green background indicates that upward volatility prevails, while a red background indicates downward volatility.
The indicator allows traders to quickly assess in which direction the market is more volatile at the moment, which can be useful for making trading decisions and evaluating the current market situation.
Phát hành các Ghi chú
Some refactoringPhát hành các Ghi chú
some refactoring. Added the ability to smooth McGinley Dynamic. Added the ability to normalize volatility to percentages.Mã nguồn mở
Theo đúng tinh thần TradingView, tác giả của tập lệnh này đã công bố nó dưới dạng mã nguồn mở, để các nhà giao dịch có thể xem xét và xác minh chức năng. Chúc mừng tác giả! Mặc dù bạn có thể sử dụng miễn phí, hãy nhớ rằng việc công bố lại mã phải tuân theo Nội quy.
Thông báo miễn trừ trách nhiệm
Thông tin và các ấn phẩm này không nhằm mục đích, và không cấu thành, lời khuyên hoặc khuyến nghị về tài chính, đầu tư, giao dịch hay các loại khác do TradingView cung cấp hoặc xác nhận. Đọc thêm tại Điều khoản Sử dụng.
Mã nguồn mở
Theo đúng tinh thần TradingView, tác giả của tập lệnh này đã công bố nó dưới dạng mã nguồn mở, để các nhà giao dịch có thể xem xét và xác minh chức năng. Chúc mừng tác giả! Mặc dù bạn có thể sử dụng miễn phí, hãy nhớ rằng việc công bố lại mã phải tuân theo Nội quy.
Thông báo miễn trừ trách nhiệm
Thông tin và các ấn phẩm này không nhằm mục đích, và không cấu thành, lời khuyên hoặc khuyến nghị về tài chính, đầu tư, giao dịch hay các loại khác do TradingView cung cấp hoặc xác nhận. Đọc thêm tại Điều khoản Sử dụng.