PROTECTED SOURCE SCRIPT
Cập nhật CCI heatmap(15-170)

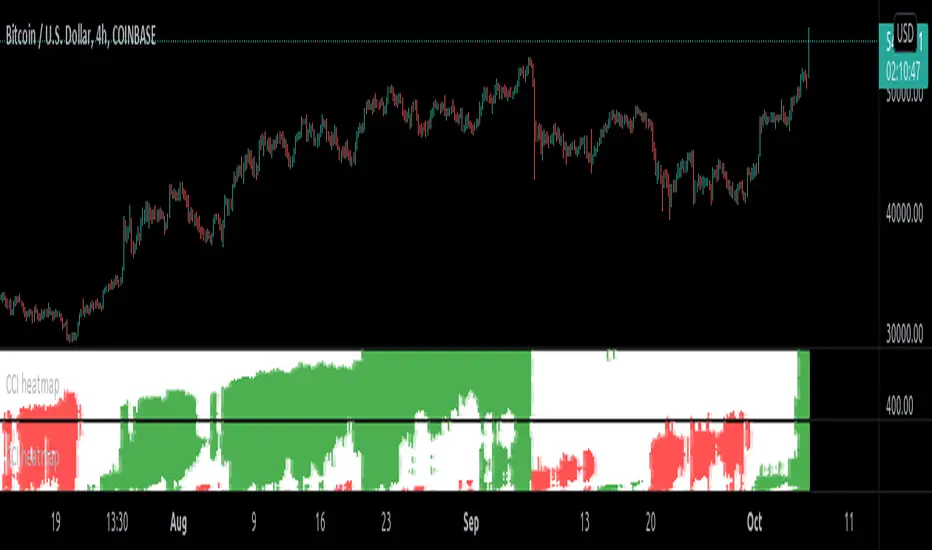
This is CCI (Commodity channel index) heatmap for the period lengths (15 to 170).
How to use :
1.) When overwhelming green appears, it means price is supposed to be trending up.
2.) When white appears, it means price is supposed to be neutral.
3.) When overwhelming red appears, it means price is supposed to be trending down.
Note: This indicator is supposed to be used with CCI heatmap(175-330) and CCI heatmap(335-490) aligned in increasing order of period lengths for higher resolution of period lengths. Otherwise use CCI heatmap(low resolution) indicator in which these 3 high resolution indicator is adjusted to a single indicator.
(Expect remaining indicator to be published to the public in mid of march 2021)
Phát hành các Ghi chú
Expanded the current script from input lengths (15-170) to now (20-330). Therefore no need of multiple instances/resolutions of same indicator.Phát hành các Ghi chú
This is advanced version of CCI ( Commodity channel index ) heatmap .
Add 2 instances of same indicator and put 'set2 lengths' above 'set1 lengths' (align in increasing order of period lengths) to get continuous pattern for larger picture otherwise you can always use just default set1 as well .
How to use :
1.) When overwhelming green appears, it means price is supposed to be trending up.
2.) When overwhelming red appears, it means price is supposed to be trending down.
3.) When white appears, it means price is currently neutral , at this point get ready and expect a breakout in either direction . In other words overwhelming white suggest asset is currently highly compressed(fuel in the tank) and expected to expand(burn the fuel) in either direction .
Did you know : CCI resembles Bollinger bands with 1.25 standard deviation . In CCI +100 and -100 resembles upper and lower band of bollinger band with 1.25 standard deviation (multi).
Mã được bảo vệ
Tập lệnh này được đăng dưới dạng mã nguồn đóng. Tuy nhiên, bạn có thể sử dụng tự do và không giới hạn – tìm hiểu thêm tại đây.
Thông báo miễn trừ trách nhiệm
Thông tin và các ấn phẩm này không nhằm mục đích, và không cấu thành, lời khuyên hoặc khuyến nghị về tài chính, đầu tư, giao dịch hay các loại khác do TradingView cung cấp hoặc xác nhận. Đọc thêm tại Điều khoản Sử dụng.