PROTECTED SOURCE SCRIPT
MTF Trend Dashboard LITE (Daily & 4H)
Overview
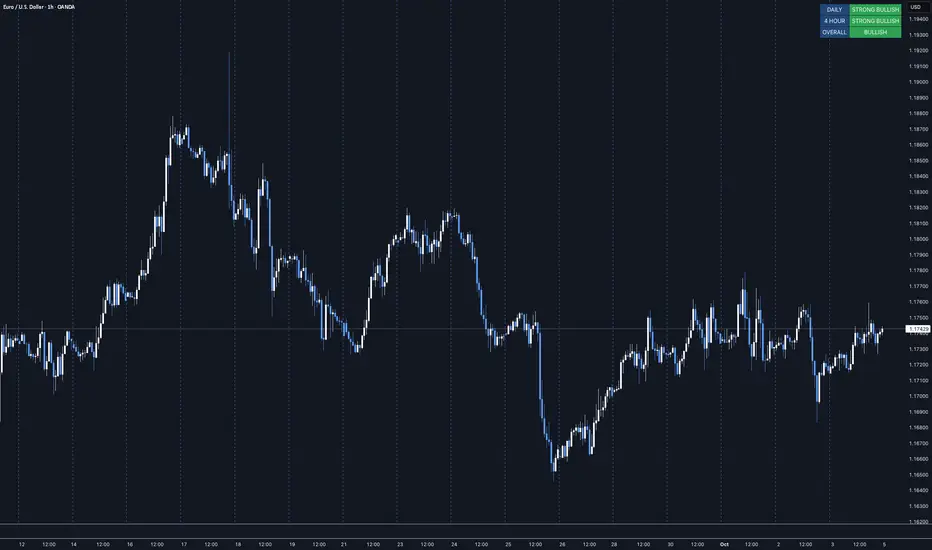
The MTF Trend Dashboard LITE by G.C provides instant directional clarity between the Daily and 4-Hour timeframes using refined EMA (9 / 21) logic.
It’s built for traders who want simple, accurate trend confirmation without switching between multiple charts.
Why It Matters
One of the biggest causes of trading errors is timeframe conflict — seeing a bullish setup on one chart and a bearish signal on another.
This tool solves that problem by showing both the Daily and 4H structure side-by-side, using objective EMA-based logic.
When both agree, bias is strong. When they conflict, it’s a signal to wait.
Core Features
• Two-timeframe dashboard (Daily + 4H)
• Non-repainting EMA (9 / 21) logic
• Color-coded states (Bullish / Bearish / Neutral)
• Lightweight and easy to read
• Adjustable panel position: Top Right / Top Left / Bottom Right / Bottom Left
How to Use
Add the indicator to any chart.
Wait for both timeframes to align before entering trades.
Mixed signals often indicate sideways or transitional markets.
Combine with your existing trading strategy for confirmation.
Trend Condition Glossary
▲ STRONG BULLISH – EMA(9) well above EMA(21) and both sloping upward. Strong upward momentum with price above both EMAs.
BULLISH – EMA(9) above EMA(21) but weaker slope or price confirmation. Moderate uptrend or early recovery.
NEUTRAL – EMAs crossing or flat. Market lacks structure — consolidation or indecision.
▼ BEARISH – EMA(9) below EMA(21) with limited slope. Mild correction or early reversal.
▼ STRONG BEARISH – EMA(9) below EMA(21), both sloping down, price below both. Strong downtrend, clear seller control.
Who It’s For
Traders who want a clean, no-noise confirmation tool to simplify directional bias decisions in swing and intraday setups.
Disclaimer
This indicator is for analytical and educational purposes only. Always trade with discipline, patience, and sound risk management.
Mã được bảo vệ
Tập lệnh này được đăng dưới dạng mã nguồn đóng. Tuy nhiên, bạn có thể sử dụng tự do và không giới hạn – tìm hiểu thêm tại đây.
Thông báo miễn trừ trách nhiệm
Thông tin và các ấn phẩm này không nhằm mục đích, và không cấu thành, lời khuyên hoặc khuyến nghị về tài chính, đầu tư, giao dịch hay các loại khác do TradingView cung cấp hoặc xác nhận. Đọc thêm tại Điều khoản Sử dụng.