PROTECTED SOURCE SCRIPT
VWAP Momentum and Volatility Indicator
VWAP Momentum and Volatility Indicator
Merges VWAP trend, momentum oscillators (RSI & Stochastic), volatility measures (ATR & Bollinger Bands) and an optional volume filter into one overlay to generate more reliable buy/sell signals.
1) Components & Rationale
VWAP (Session/Day/Week/Month): Shows the volume-weighted average price trend with selectable reset periods.
VWAP ±1/±2/±3 StdDev Bands: Highlight volatility expansions or contractions—price moves outside these bands can signal breakouts or reversals.
RSI (14): Confirms overbought (>70) and oversold (<30) momentum, reducing false entries.
Stochastic (14, SlowK=3, SlowD=3): Captures momentum shifts; used alongside RSI for stronger confirmation.
ATR (14): Measures absolute price movement to aid in risk sizing and contextualizing band widths.
Bollinger Bands (20, 2σ): Identifies “squeeze” (low volatility) and “expansion” phases.
Volume Filter (optional): Ensures signals are backed by above-average volume.
2) Default Settings
VWAP Reset: Session
StdDev Multiplier: 2.0
VWAP Lookback: 20 bars
RSI: 14 period, Overbought = 70, Oversold = 30
Stochastic: 14 period, SlowK = 3, SlowD = 3
ATR: 14 period
Bollinger Bands: 20 period, Multiplier = 2
Volume Filter: 10-bar SMA threshold at 1.5× average
Visuals: VWAP bands, signal markers, and info table enabled; table positioned top-right at small size.
3) How to Use
Add to chart: Select “VWAP Momentum and Volatility Indicator.”
Adjust inputs: Set reset period, band multiplier, momentum thresholds and volume filter to match your asset and timeframe.
Buy signal: Price crosses above VWAP + (RSI < 50 or Stochastic in oversold) + volume filter pass.
Sell signal: Price crosses below VWAP + (RSI > 50 or Stochastic in overbought) + volume filter pass.
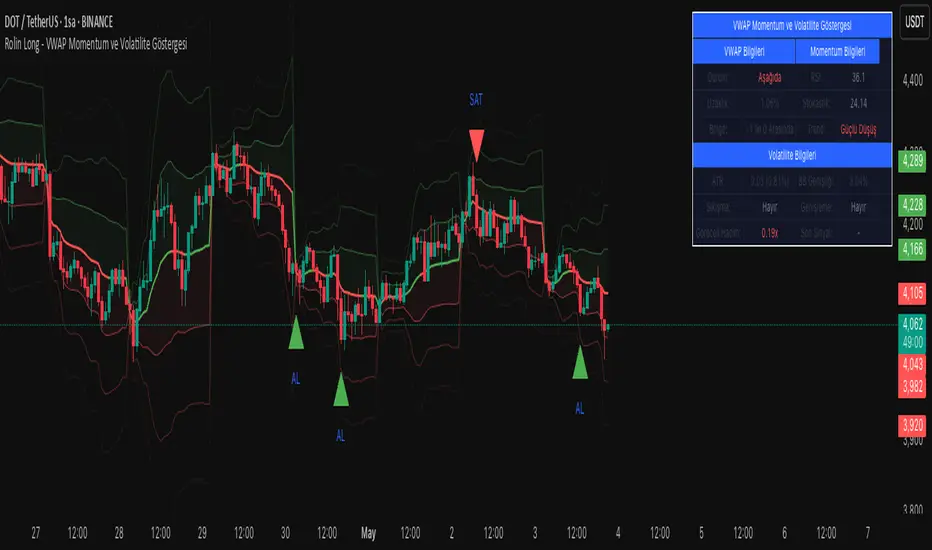
Info table: Review VWAP status, distance (%), band region, RSI, Stochastic, ATR%, Bollinger width, squeeze/expansion, relative volume, and the most recent signal.
4) Warnings & Disclaimer
This indicator is provided for educational purposes only. Always backtest with real funding and volume data, apply your own risk management, and recognize that past performance does not guarantee future results. Use the settings and signals as part of a broader trading plan.
Merges VWAP trend, momentum oscillators (RSI & Stochastic), volatility measures (ATR & Bollinger Bands) and an optional volume filter into one overlay to generate more reliable buy/sell signals.
1) Components & Rationale
VWAP (Session/Day/Week/Month): Shows the volume-weighted average price trend with selectable reset periods.
VWAP ±1/±2/±3 StdDev Bands: Highlight volatility expansions or contractions—price moves outside these bands can signal breakouts or reversals.
RSI (14): Confirms overbought (>70) and oversold (<30) momentum, reducing false entries.
Stochastic (14, SlowK=3, SlowD=3): Captures momentum shifts; used alongside RSI for stronger confirmation.
ATR (14): Measures absolute price movement to aid in risk sizing and contextualizing band widths.
Bollinger Bands (20, 2σ): Identifies “squeeze” (low volatility) and “expansion” phases.
Volume Filter (optional): Ensures signals are backed by above-average volume.
2) Default Settings
VWAP Reset: Session
StdDev Multiplier: 2.0
VWAP Lookback: 20 bars
RSI: 14 period, Overbought = 70, Oversold = 30
Stochastic: 14 period, SlowK = 3, SlowD = 3
ATR: 14 period
Bollinger Bands: 20 period, Multiplier = 2
Volume Filter: 10-bar SMA threshold at 1.5× average
Visuals: VWAP bands, signal markers, and info table enabled; table positioned top-right at small size.
3) How to Use
Add to chart: Select “VWAP Momentum and Volatility Indicator.”
Adjust inputs: Set reset period, band multiplier, momentum thresholds and volume filter to match your asset and timeframe.
Buy signal: Price crosses above VWAP + (RSI < 50 or Stochastic in oversold) + volume filter pass.
Sell signal: Price crosses below VWAP + (RSI > 50 or Stochastic in overbought) + volume filter pass.
Info table: Review VWAP status, distance (%), band region, RSI, Stochastic, ATR%, Bollinger width, squeeze/expansion, relative volume, and the most recent signal.
4) Warnings & Disclaimer
This indicator is provided for educational purposes only. Always backtest with real funding and volume data, apply your own risk management, and recognize that past performance does not guarantee future results. Use the settings and signals as part of a broader trading plan.
Mã được bảo vệ
Tập lệnh này được đăng dưới dạng mã nguồn đóng. Tuy nhiên, bạn có thể sử dụng tự do và không giới hạn – tìm hiểu thêm tại đây.
Thông báo miễn trừ trách nhiệm
Thông tin và các ấn phẩm này không nhằm mục đích, và không cấu thành, lời khuyên hoặc khuyến nghị về tài chính, đầu tư, giao dịch hay các loại khác do TradingView cung cấp hoặc xác nhận. Đọc thêm tại Điều khoản Sử dụng.