PROTECTED SOURCE SCRIPT
Valuation Bands (Dynamic + Table)
Valuation Bands (Dynamic + Table)
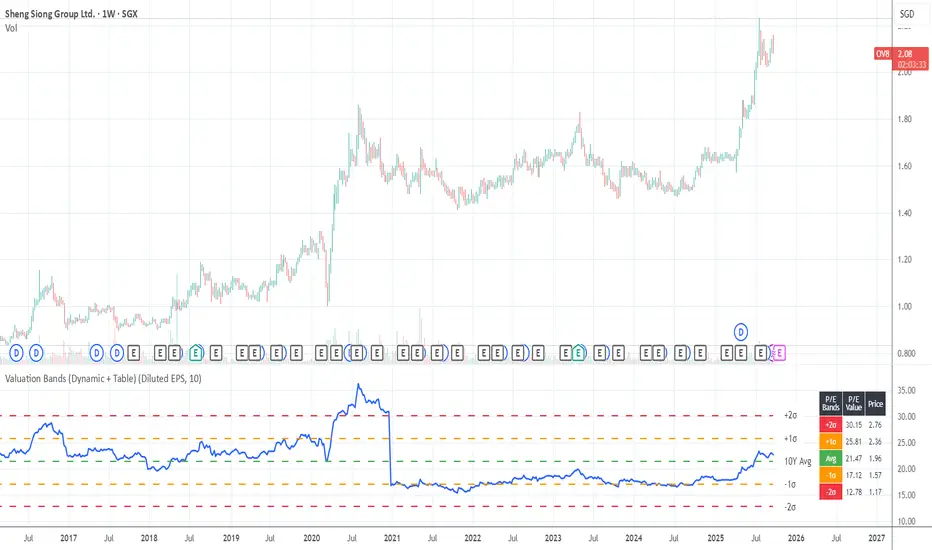
This indicator helps investors assess whether a stock is trading at cheap, fair, or expensive levels relative to its historical valuation multiples. It dynamically calculates valuation ratios such as P/E, P/B, P/S, P/Operating Income, P/Cash Flow, or Dividend Yield over a customizable lookback period (e.g., 10 years).
Using these ratios, the script plots the long-term average alongside ±1σ and ±2σ standard deviation bands, highlighting valuation zones. The included data table displays both the multiple values and their corresponding price levels, making it easy to interpret fair value ranges.
Alerts are built in to notify when the current ratio crosses into undervalued (–2σ) or overvalued (+2σ) zones, helping investors spot potential opportunities or risks.
In short, this tool bridges fundamentals with technical visualization, giving a quick snapshot of how today’s valuation compares to historical norms.
Mã được bảo vệ
Tập lệnh này được đăng dưới dạng mã nguồn đóng. Tuy nhiên, bạn có thể sử dụng tự do và không giới hạn – tìm hiểu thêm tại đây.
Thông báo miễn trừ trách nhiệm
Thông tin và các ấn phẩm này không nhằm mục đích, và không cấu thành, lời khuyên hoặc khuyến nghị về tài chính, đầu tư, giao dịch hay các loại khác do TradingView cung cấp hoặc xác nhận. Đọc thêm tại Điều khoản Sử dụng.