PROTECTED SOURCE SCRIPT
Cập nhật MC RSI + Stoch (multi-level bands)
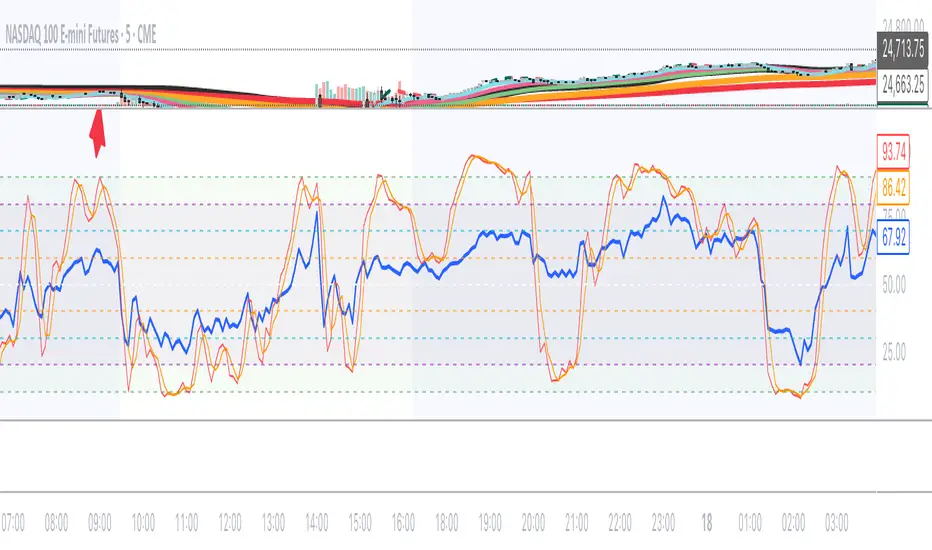
This indicator combines RSI and Stochastic Oscillator into a single panel for easier market analysis. It is designed for traders who want both momentum context and precise timing, with multiple reference levels for better decision-making.
🔧 Features
RSI (Relative Strength Index) with adjustable length (default 14).
Stochastic Oscillator (default 18, 9, 5) with smoothing applied to %K.
Both oscillators plotted in the same scale (0–100) for clear comparison.
Custom horizontal levels:
10 & 90 (purple)
20 & 80 (teal)
30 & 70 (blue)
40 & 60 (gray)
50 midline (red) for balance point reference.
Optional shaded band between 20–80 for quick visualization of momentum extremes.
Toggle switches to show/hide RSI or Stochastic independently.
🎯 How to Use
RSI gives the overall momentum strength.
Stochastic provides faster entry/exit signals by showing short-term momentum shifts.
Use the multi-level bands to identify different market conditions:
10/90 = Extreme exhaustion zones.
20/80 = Overbought/oversold boundaries.
30/70 = Secondary confirmation levels.
40/60 = Neutral momentum bands.
50 = Midline equilibrium.
Phát hành các Ghi chú
This indicator combines RSI and Stochastic Oscillator into a single panel for easier market analysis. It is designed for traders who want both momentum context and precise timing, with multiple reference levels for better decision-making.🔧 Features
RSI (Relative Strength Index) with adjustable length (default 14).
Stochastic Oscillator (default 18, 9, 5) with smoothing applied to %K.
Both oscillators plotted in the same scale (0–100) for clear comparison.
Custom horizontal levels:
10 & 90 (purple)
20 & 80 (teal)
30 & 70 (blue)
40 & 60 (gray)
50 midline (red) for balance point reference.
Optional shaded band between 20–80 for quick visualization of momentum extremes.
Toggle switches to show/hide RSI or Stochastic independently.
Mã được bảo vệ
Tập lệnh này được đăng dưới dạng mã nguồn đóng. Tuy nhiên, bạn có thể sử dụng tự do và không giới hạn – tìm hiểu thêm tại đây.
Thông báo miễn trừ trách nhiệm
Thông tin và các ấn phẩm này không nhằm mục đích, và không cấu thành, lời khuyên hoặc khuyến nghị về tài chính, đầu tư, giao dịch hay các loại khác do TradingView cung cấp hoặc xác nhận. Đọc thêm tại Điều khoản Sử dụng.