PROTECTED SOURCE SCRIPT
Cập nhật MTF RSI Grid with MFI [checkm8]
Hello and welcome to my version of the multi-timeframe RSI grid, with MFI.
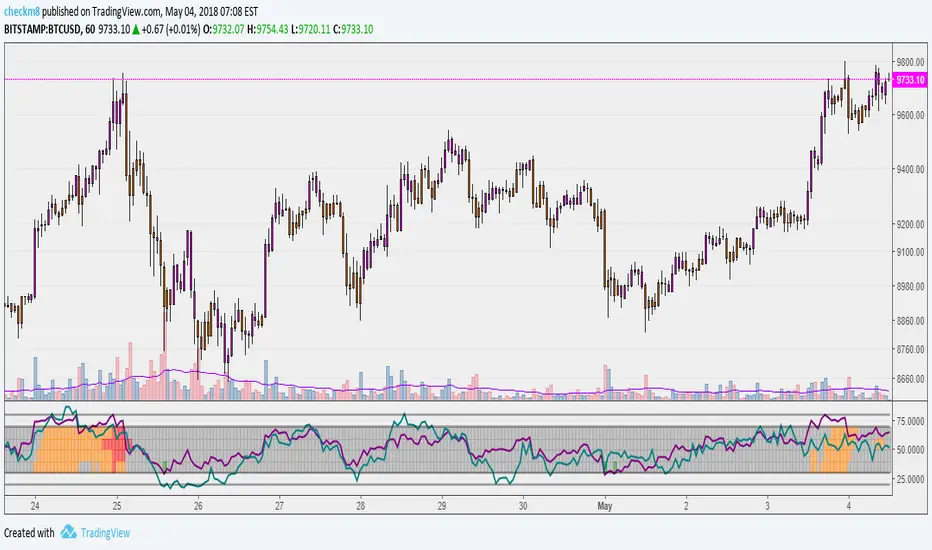
This oscillator is relatively simple and plots four sets of timeframes (selected by the user) within the levels between 30 and 70. In addition to this, it plots the RSI from the current timeframe, as well as the MFI.
As per the default settings:
1) The grid will show lime-colored blocks when the RSI is below 20 and green blocks when RSI is below 30.
2) The grid will show red-colored blocks when RSI is above 80 and orange blocks when RSI is above 70.
3) The initial MTF setup is set to 1 Hour, 2 Hour, 3 Hour, and 4 Hour timeframes. You can adjust this to your preference in the oscillator settings.
4) The purple line is RSI, the teal line is MFI.
Note: the grid only displays RSI values, not MFI.
Happy trading!
Phát hành các Ghi chú
Fix for MTF grid (re: TradingView columns visual update)Mã được bảo vệ
Tập lệnh này được đăng dưới dạng mã nguồn đóng. Tuy nhiên, bạn có thể sử dụng tự do và không giới hạn – tìm hiểu thêm tại đây.
Thông báo miễn trừ trách nhiệm
Thông tin và các ấn phẩm này không nhằm mục đích, và không cấu thành, lời khuyên hoặc khuyến nghị về tài chính, đầu tư, giao dịch hay các loại khác do TradingView cung cấp hoặc xác nhận. Đọc thêm tại Điều khoản Sử dụng.
Mã được bảo vệ
Tập lệnh này được đăng dưới dạng mã nguồn đóng. Tuy nhiên, bạn có thể sử dụng tự do và không giới hạn – tìm hiểu thêm tại đây.
Thông báo miễn trừ trách nhiệm
Thông tin và các ấn phẩm này không nhằm mục đích, và không cấu thành, lời khuyên hoặc khuyến nghị về tài chính, đầu tư, giao dịch hay các loại khác do TradingView cung cấp hoặc xác nhận. Đọc thêm tại Điều khoản Sử dụng.