PROTECTED SOURCE SCRIPT
Cập nhật Vol-Sensitivity Ratio: dVIX% / dSPX%
Vol-Sensitivity Ratio: dVIX% / dSPX%
Hey guys — I built a custom TradingView indicator to track how reactive the VIX is to SPX moves.
It’s basically a quick visual on market fear vs. complacency, and how volatility responds in real time.
How It Works
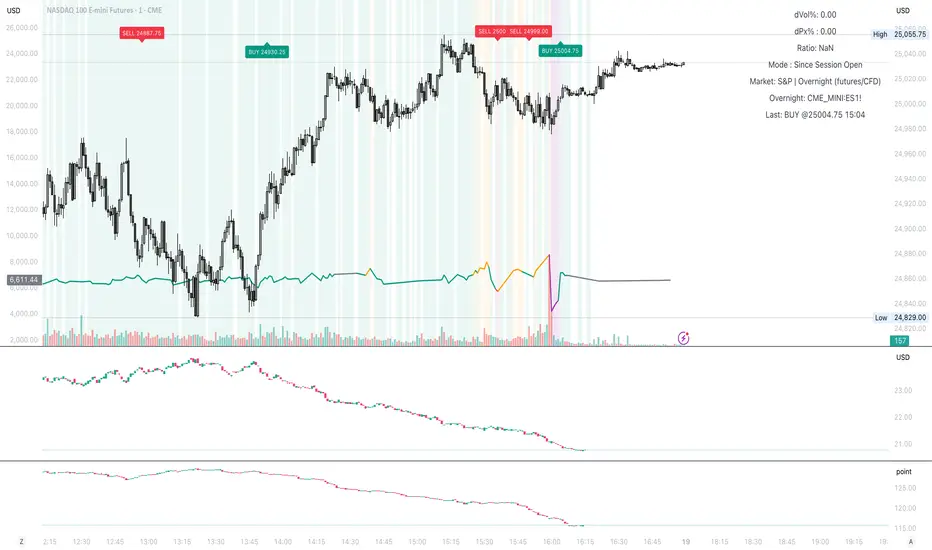
Calculates the ratio of VIX % change ÷ SPX % change
Shows color-coded zones for market behavior:
🔴 SPX & VIX rising → Bearish divergence
🟠 Weak VIX response → Complacency
🟩 Normal inverse → Healthy market
🟣 Extreme ratio → Volatility stress
How to Use
Add the script to your TradingView chart
Choose mode → Since Session Open (intraday) or From Prior Close (swing)
Watch the ratio line, color bands, and mini dashboard (shows dVIX%, dSPX%, and ratio)
It also supports alerts for when the market enters stress, divergence, or complacency zones.
Why I Made It
Hek often talks about VIX, VVIX, and volatility dynamics during trading.
That got me thinking about how to actually quantify the relationship instead of just “watching” it.
thanks to chatgpt I was able to turn into a visual
Now I’ll be forward-testing it in live markets and on a few prop accounts to see how useful it is in real-time conditions.
Feel free to try it out, tweak it, and share feedback or observations. Would love to see how it performs for others too.
Hey guys — I built a custom TradingView indicator to track how reactive the VIX is to SPX moves.
It’s basically a quick visual on market fear vs. complacency, and how volatility responds in real time.
How It Works
Calculates the ratio of VIX % change ÷ SPX % change
Shows color-coded zones for market behavior:
🔴 SPX & VIX rising → Bearish divergence
🟠 Weak VIX response → Complacency
🟩 Normal inverse → Healthy market
🟣 Extreme ratio → Volatility stress
How to Use
Add the script to your TradingView chart
Choose mode → Since Session Open (intraday) or From Prior Close (swing)
Watch the ratio line, color bands, and mini dashboard (shows dVIX%, dSPX%, and ratio)
It also supports alerts for when the market enters stress, divergence, or complacency zones.
Why I Made It
Hek often talks about VIX, VVIX, and volatility dynamics during trading.
That got me thinking about how to actually quantify the relationship instead of just “watching” it.
thanks to chatgpt I was able to turn into a visual
Now I’ll be forward-testing it in live markets and on a few prop accounts to see how useful it is in real-time conditions.
Feel free to try it out, tweak it, and share feedback or observations. Would love to see how it performs for others too.
Phát hành các Ghi chú
updatedPhát hành các Ghi chú
Live signals etc.Phát hành các Ghi chú
More updatesMã được bảo vệ
Tập lệnh này được đăng dưới dạng mã nguồn đóng. Tuy nhiên, bạn có thể sử dụng tự do và không giới hạn – tìm hiểu thêm tại đây.
Thông báo miễn trừ trách nhiệm
Thông tin và các ấn phẩm này không nhằm mục đích, và không cấu thành, lời khuyên hoặc khuyến nghị về tài chính, đầu tư, giao dịch hay các loại khác do TradingView cung cấp hoặc xác nhận. Đọc thêm tại Điều khoản Sử dụng.
Mã được bảo vệ
Tập lệnh này được đăng dưới dạng mã nguồn đóng. Tuy nhiên, bạn có thể sử dụng tự do và không giới hạn – tìm hiểu thêm tại đây.
Thông báo miễn trừ trách nhiệm
Thông tin và các ấn phẩm này không nhằm mục đích, và không cấu thành, lời khuyên hoặc khuyến nghị về tài chính, đầu tư, giao dịch hay các loại khác do TradingView cung cấp hoặc xác nhận. Đọc thêm tại Điều khoản Sử dụng.