OPEN-SOURCE SCRIPT
Cập nhật Last xHL
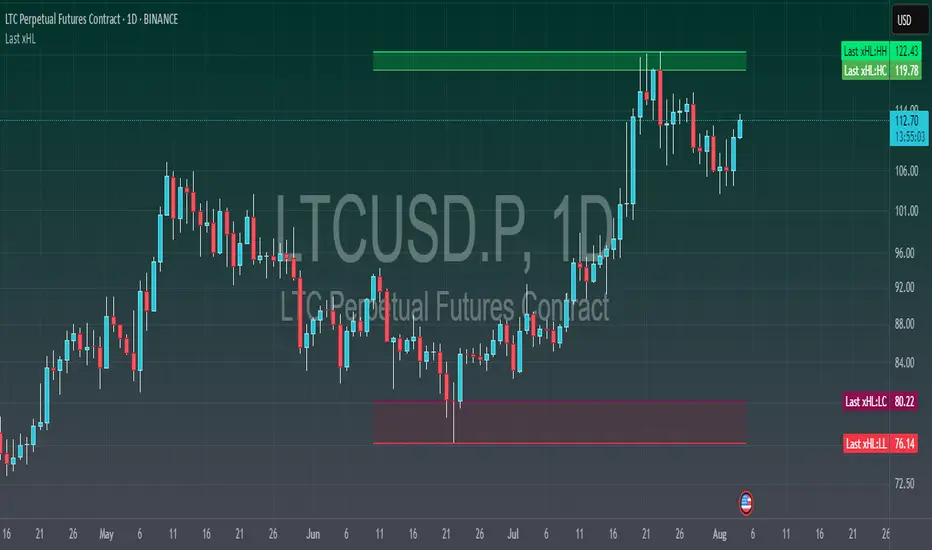
📈 Last xHL – Visualize Key Highs and Lows
This script highlights the most recent significant highs and lows over a user-defined period, helping traders quickly identify key support and resistance zones.
🔍 Features:
⚙️ Customization:
🧠 Use Case:
This tool is ideal for traders who want to:
This script highlights the most recent significant highs and lows over a user-defined period, helping traders quickly identify key support and resistance zones.
🔍 Features:
- Highest High (HH) and Highest Close/Open (HC) lines
- Lowest Low (LL) and Lowest Close/Open (LC) lines
- Dynamic updates with each new bar
- Gradient-filled zones between HH–HC and LL–LC for visual clarity
⚙️ Customization:
- Adjustable lookback period (_length) to suit your trading style
- Color-coded lines and fills for quick interpretation
🧠 Use Case:
This tool is ideal for traders who want to:
- Spot potential breakout or reversal zones
- Identify price compression or expansion areas
- Enhance their technical analysis with visual cues
This script is for educational and informational purposes only. It does not constitute financial advice. Always do your own research before making trading decisions.
Phát hành các Ghi chú
✅ New Feature:The values of HH, HC, LL, and LC are now also plotted invisibly to appear in the Data Window and on the Price Scale, allowing for easier reference and analysis without cluttering the chart.
Mã nguồn mở
Theo đúng tinh thần TradingView, tác giả của tập lệnh này đã công bố nó dưới dạng mã nguồn mở, để các nhà giao dịch có thể xem xét và xác minh chức năng. Chúc mừng tác giả! Mặc dù bạn có thể sử dụng miễn phí, hãy nhớ rằng việc công bố lại mã phải tuân theo Nội quy.
Show your piety to your god. World needs your humanity.
Thông báo miễn trừ trách nhiệm
Thông tin và các ấn phẩm này không nhằm mục đích, và không cấu thành, lời khuyên hoặc khuyến nghị về tài chính, đầu tư, giao dịch hay các loại khác do TradingView cung cấp hoặc xác nhận. Đọc thêm tại Điều khoản Sử dụng.