OPEN-SOURCE SCRIPT
Volume Liqidations [EagleVSniper]
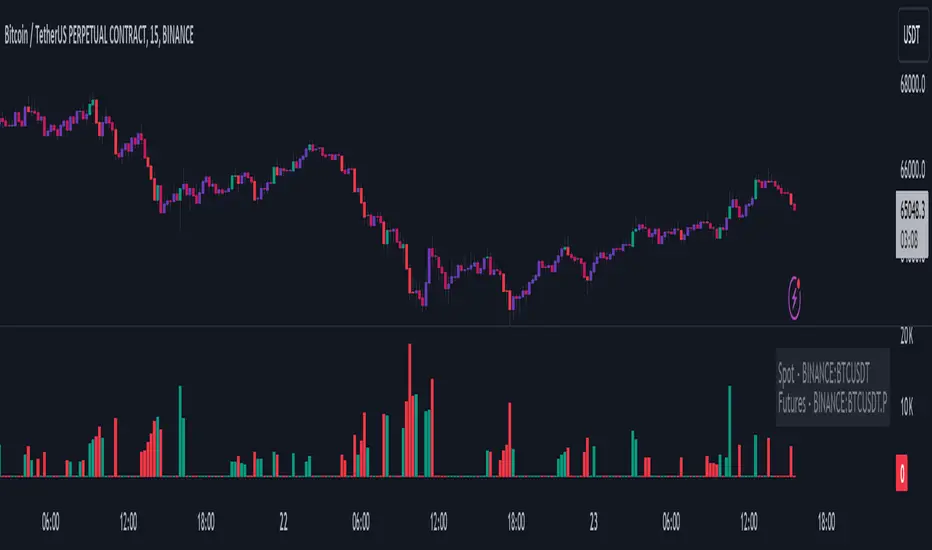
The Volume Liquidations Indicator is designed for traders who want to spot significant liquidation events in the cryptocurrency markets, particularly between spot and futures volumes. This powerful tool auto-detects the trading asset and compares the volume data from both spot and futures markets to highlight potential high-volume liquidation points that can significantly impact price movement. Raw source code owner - tartigradia
Features:
How to Use:
Features:
- Auto-Detect Functionality: Automatically identifies the current trading asset, providing an option for manual selection for both spot and futures symbols.
- Volume Comparison: Calculates the difference between futures and spot volumes within a user-defined timeframe, helping to identify liquidation events.
- Customizable Parameters: Offers customizable options for multipliers, lookback periods, and timeframe selection to tailor the indicator to your trading strategy.
- Visual Indicators: Displays liquidation volumes as color-coded columns, with green indicating potential long liquidations and red for short liquidations. It also highlights bars that exceed the high-volume threshold, providing a clear visual cue for significant liquidation events.
- Spot and Futures Volume MA: Includes optional moving average plots for both spot and futures volumes, allowing for a deeper analysis of market trends.
- Highlighting High-Volatility Candles: The indicator uniquely colors candles that reach a predefined volatility threshold, determined by the user-set multiplier. This functionality aims to spotlight moments of significant market volatility, providing traders with immediate visual cues.
- Dynamic Ticker Selection: Seamlessly switches between auto and manual ticker selection, providing flexibility for all types of traders.
How to Use:
- Setup: Configure the indicator to your preferences. You can choose between automatic or manual ticker selection, set the multiplier for the high-volume threshold, and define the lookback period for the moving average calculation.
- Analysis: The indicator plots differences in volume between futures and spot markets as columns on your chart, color-coded to indicate the direction of potential liquidations.
- Decision Making: Use the indicator to identify potential liquidation events. High-volume thresholds are highlighted, suggesting significant market movements. Combine this information with other analysis tools to make informed trading decisions.
Mã nguồn mở
Theo đúng tinh thần TradingView, tác giả của tập lệnh này đã công bố nó dưới dạng mã nguồn mở, để các nhà giao dịch có thể xem xét và xác minh chức năng. Chúc mừng tác giả! Mặc dù bạn có thể sử dụng miễn phí, hãy nhớ rằng việc công bố lại mã phải tuân theo Nội quy.
Thông báo miễn trừ trách nhiệm
Thông tin và các ấn phẩm này không nhằm mục đích, và không cấu thành, lời khuyên hoặc khuyến nghị về tài chính, đầu tư, giao dịch hay các loại khác do TradingView cung cấp hoặc xác nhận. Đọc thêm tại Điều khoản Sử dụng.