OPEN-SOURCE SCRIPT
Cập nhật Chips Average Line (volume price) by RSU
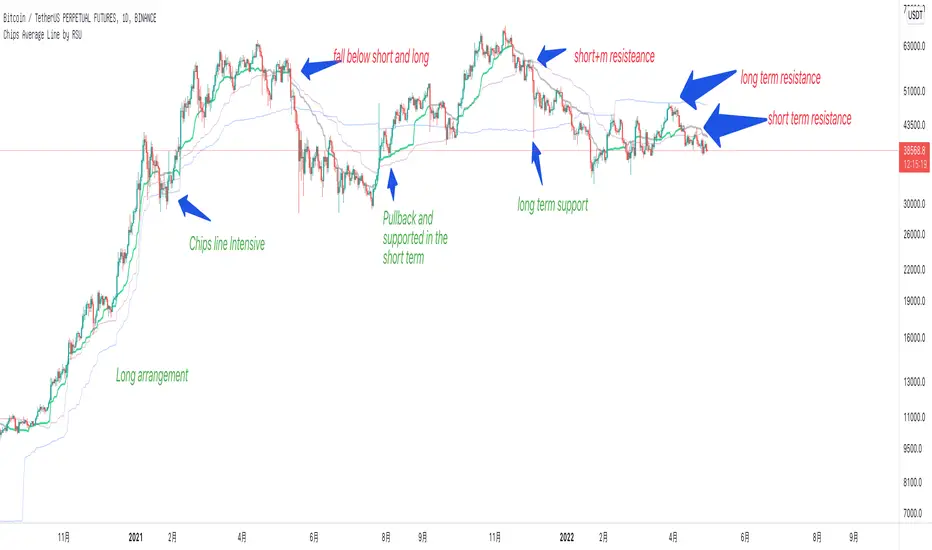
This is a very important volume-price indicator for me.
Displays the average cost of chips for the short term (30 days), medium term (60 days), and long term (200 days).
Chip lines act as support and resistance. The longer the trend days, the greater the strength.
usage:
1. Breakout: If the stock rises, it must be above the short-term chip line. And gradually rise.
2. Sequence: When a bullish trend is formed, the short-term stack is higher than the mid-term stack, and the mid-flag stack is higher than the long-term stack. When there is a bear trend, the order is reversed.
3. Intensive: When the three chip lines are dense, there will be a periodical resonance effect, and the long-term trend will rise or fall sharply
Phát hành các Ghi chú
Added smoothing parameter to reduce the jaggedness of the indicator.Phát hành các Ghi chú
Changes:All timeframes are supported.Mã nguồn mở
Theo đúng tinh thần TradingView, tác giả của tập lệnh này đã công bố nó dưới dạng mã nguồn mở, để các nhà giao dịch có thể xem xét và xác minh chức năng. Chúc mừng tác giả! Mặc dù bạn có thể sử dụng miễn phí, hãy nhớ rằng việc công bố lại mã phải tuân theo Nội quy.
Thông báo miễn trừ trách nhiệm
Thông tin và các ấn phẩm này không nhằm mục đích, và không cấu thành, lời khuyên hoặc khuyến nghị về tài chính, đầu tư, giao dịch hay các loại khác do TradingView cung cấp hoặc xác nhận. Đọc thêm tại Điều khoản Sử dụng.
Mã nguồn mở
Theo đúng tinh thần TradingView, tác giả của tập lệnh này đã công bố nó dưới dạng mã nguồn mở, để các nhà giao dịch có thể xem xét và xác minh chức năng. Chúc mừng tác giả! Mặc dù bạn có thể sử dụng miễn phí, hãy nhớ rằng việc công bố lại mã phải tuân theo Nội quy.
Thông báo miễn trừ trách nhiệm
Thông tin và các ấn phẩm này không nhằm mục đích, và không cấu thành, lời khuyên hoặc khuyến nghị về tài chính, đầu tư, giao dịch hay các loại khác do TradingView cung cấp hoặc xác nhận. Đọc thêm tại Điều khoản Sử dụng.