PROTECTED SOURCE SCRIPT
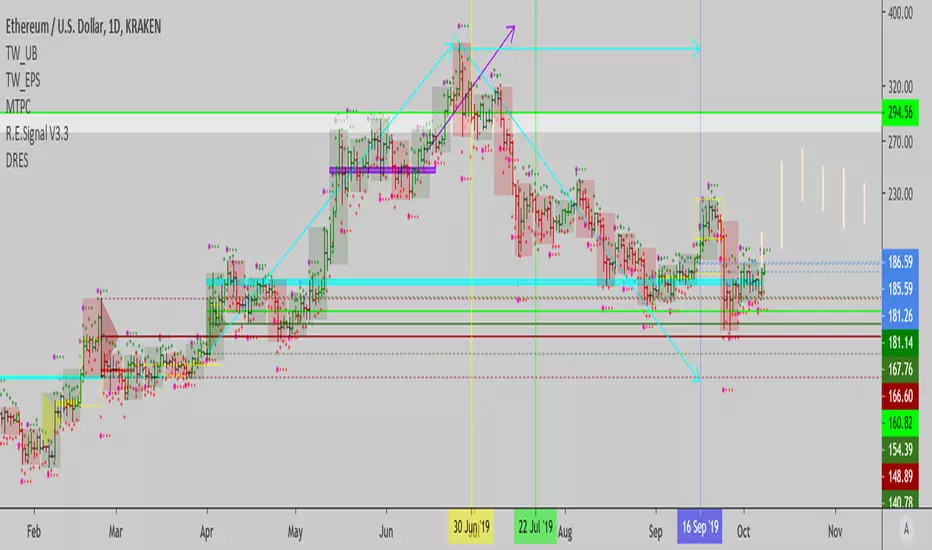
Daily Range Exhaustion Signal

This tool plots the average true range distance from each bar's open, up and down, so you can tell when a bar moves by more than the average distance a day's range usually travels. It's an interesting concept, but not something I use a lot of the time. Looking at the range relative to the last bar's range, is what I normally do to find bouts of strength or weakness, and to determine if these moves have follow through or not.
You may experiment with this indicator to see if it helps in your price action analysis. Usually, bigger than 1 ATR moves don't keep going for much more, unless there's some outrageous news related to the move.
This idea came from a conversation with Yacine Kanoun here, and I coded it into an indicator.
Credit where credit is due (right Yacine?)...
Cheers,
Ivan Labrie.
Mã được bảo vệ
Tập lệnh này được đăng dưới dạng mã nguồn đóng. Tuy nhiên, bạn có thể sử dụng tự do và không giới hạn – tìm hiểu thêm tại đây.
Thông báo miễn trừ trách nhiệm
Thông tin và các ấn phẩm này không nhằm mục đích, và không cấu thành, lời khuyên hoặc khuyến nghị về tài chính, đầu tư, giao dịch hay các loại khác do TradingView cung cấp hoặc xác nhận. Đọc thêm tại Điều khoản Sử dụng.