DCT - Liquidity Heatmap - Pro
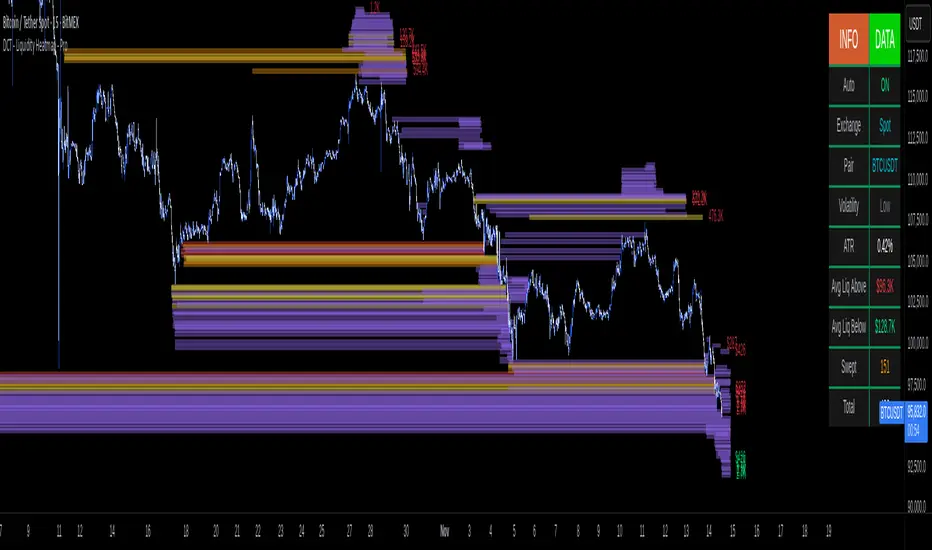
This indicator visualizes liquidity levels by analyzing volume intensity, order flow structure, and price interaction. It highlights areas where buy-side and sell-side liquidity builds up, showing potential zones of interest.
WHAT IT DOES
- Detects buy-side and sell-side liquidity levels
- Tracks swept zones
- Displays volume intensity using a color-graded system
- Optional CVD mode showing directional volume bias
- Adapts automatically to different market types and volatility states
- Extends active levels forward
- Cleans up old data automatically
- Includes optional alert conditions
KEY FEATURES
- Automatic market and volatility identification
- Smart spacing and level management
- Optional CVD tracking
- Forward level projection
- Swept level preservation
- Imbalance markers
- Real-time info table with liquidity stats, volatility state, and level counts
- Memory-optimized handling for long charts
IMPORTANT NOTES
- Not a predictive tool
- Not a standalone trading system
- Effectiveness varies by timeframe and data quality
- Optimized for crypto markets
- Historical visualization shows past detected levels
HOW TO USE
- Add indicator to your chart
- Adjust spacing to widen or tighten clusters
- Enable CVD if directional pressure is needed
- Configure alerts if desired
- Use Compact mode on smaller screens
TECHNICAL DETAILS
- Pine v6
- Overlay: true
- Max boxes: 500
- Memory optimized
- Works on Perpetual and Spot crypto markets
DISCLAIMER
For analysis and educational use only. No financial advice. Markets can behave unpredictably. Use your own judgment and risk management.
Tập lệnh chỉ hiển thị cho người được mời
Chỉ những người dùng được tác giả chấp thuận mới có thể truy cập tập lệnh này. Bạn sẽ cần yêu cầu và được cấp quyền sử dụng. Thông thường quyền này được cấp sau khi thanh toán. Để biết thêm chi tiết, làm theo hướng dẫn của tác giả bên dưới hoặc liên hệ trực tiếp với Daily-Crypto-Trading.
TradingView KHÔNG khuyến nghị bạn trả phí hoặc sử dụng một tập lệnh trừ khi bạn hoàn toàn tin tưởng vào tác giả và hiểu cách hoạt động của tập lệnh. Bạn cũng có thể tìm các lựa chọn miễn phí, mã nguồn mở trong các script cộng đồng của chúng tôi.
Hướng dẫn của tác giả
Thông báo miễn trừ trách nhiệm
Tập lệnh chỉ hiển thị cho người được mời
Chỉ những người dùng được tác giả chấp thuận mới có thể truy cập tập lệnh này. Bạn sẽ cần yêu cầu và được cấp quyền sử dụng. Thông thường quyền này được cấp sau khi thanh toán. Để biết thêm chi tiết, làm theo hướng dẫn của tác giả bên dưới hoặc liên hệ trực tiếp với Daily-Crypto-Trading.
TradingView KHÔNG khuyến nghị bạn trả phí hoặc sử dụng một tập lệnh trừ khi bạn hoàn toàn tin tưởng vào tác giả và hiểu cách hoạt động của tập lệnh. Bạn cũng có thể tìm các lựa chọn miễn phí, mã nguồn mở trong các script cộng đồng của chúng tôi.