PROTECTED SOURCE SCRIPT
Wyckoff PhaseMap Overlay [FxalgoxPro]
📊 Wyckoff PhaseMap Overlay [Fxalgox]
Professional Wyckoff Market Cycle Indicator for TradingView
━━━━━━━━━━━━━━━━━━━━━━━━━━━━━━━━━━━━━━━━
🎯 OVERVIEW
The Wyckoff PhaseMap Overlay is a sophisticated indicator that automatically identifies and visualizes the four phases of the Wyckoff Market Cycle on your price chart, combining price action analysis with volume confirmation to detect:
━━━━━━━━━━━━━━━━━━━━━━━━━━━━━━━━━━━━━━━━
🔑 KEY FEATURES
📈 Phase Detection
🎨 Visual Elements
📊 Dashboard
🔔 Alerts
━━━━━━━━━━━━━━━━━━━━━━━━━━━━━━━━━━━━━━━━
⚙️ CONFIGURATION
Wyckoff Phases (Main Settings)
Phase 1: Accumulation
Phase 2: Mark Up
Phase 3: Distribution
Phase 4: Mark Down
Visual Settings
Dashboard
━━━━━━━━━━━━━━━━━━━━━━━━━━━━━━━━━━━━━━━━
🧠 HOW IT WORKS
Phase Detection Logic
1️⃣ Accumulation (Cause)
2️⃣ Mark Up (Effect)
3️⃣ Distribution (Cause)
4️⃣ Mark Down (Effect)
━━━━━━━━━━━━━━━━━━━━━━━━━━━━━━━━━━━━━━━━
📝 EVENT DEFINITIONS
━━━━━━━━━━━━━━━━━━━━━━━━━━━━━━━━━━━━━━━━
🎯 USE CASES
For Traders
For Analysts
━━━━━━━━━━━━━━━━━━━━━━━━━━━━━━━━━━━━━━━━
🎨 RECOMMENDED SETTINGS
For Swing Trading (Daily/4H)
For Intraday Trading (1H/15m)
For Long-term Investors (Weekly)
━━━━━━━━━━━━━━━━━━━━━━━━━━━━━━━━━━━━━━━━
📚 WYCKOFF METHOD RESOURCES
The indicator is based on Richard Wyckoff's market cycle theory:
Learn More:
━━━━━━━━━━━━━━━━━━━━━━━━━━━━━━━━━━━━━━━━
⚠️ IMPORTANT NOTES
━━━━━━━━━━━━━━━━━━━━━━━━━━━━━━━━━━━━━━━━
🐛 TROUBLESHOOTING
Q: Why aren't any phases showing?
Q: Too many false signals?
Q: Dashboard not showing?
━━━━━━━━━━━━━━━━━━━━━━━━━━━━━━━━━━━━━━━━
👨💻 CREDITS
Developer: Fxalgox
Method: Richard Wyckoff Market Cycle Theory
━━━━━━━━━━━━━━━━━━━━━━━━━━━━━━━━━━━━━━━━
💡 TIPS FOR BEST RESULTS
━━━━━━━━━━━━━━━━━━━━━━━━━━━━━━━━━━━━━━━━
Happy Trading! 📈
Remember: This indicator is a tool for analysis, not financial advice. Always manage risk appropriately.
Professional Wyckoff Market Cycle Indicator for TradingView
━━━━━━━━━━━━━━━━━━━━━━━━━━━━━━━━━━━━━━━━
🎯 OVERVIEW
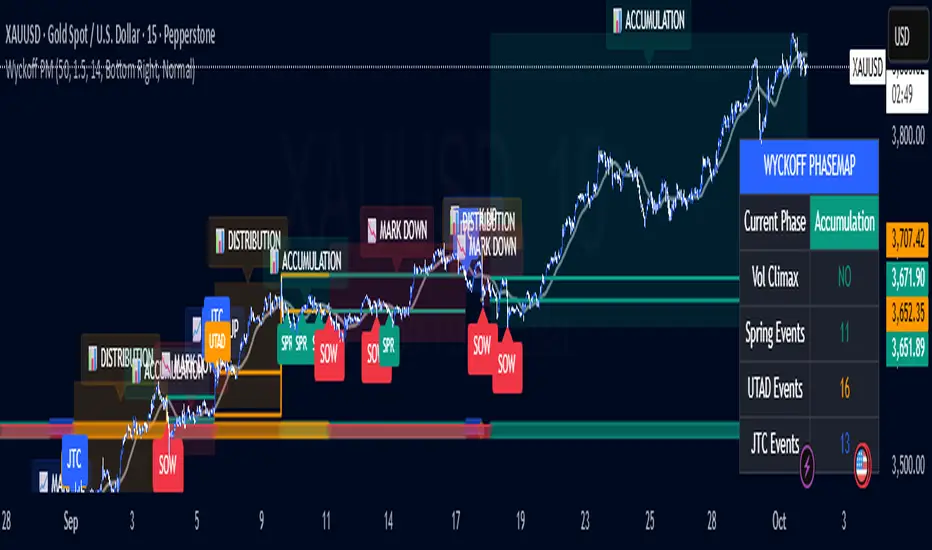
The Wyckoff PhaseMap Overlay is a sophisticated indicator that automatically identifies and visualizes the four phases of the Wyckoff Market Cycle on your price chart, combining price action analysis with volume confirmation to detect:
- Phase 1: Accumulation (Cause)
- Phase 2: Mark Up (Effect)
- Phase 3: Distribution (Cause)
- Phase 4: Mark Down (Effect)
━━━━━━━━━━━━━━━━━━━━━━━━━━━━━━━━━━━━━━━━
🔑 KEY FEATURES
📈 Phase Detection
- Accumulation: Identifies selling climax (SC), automatic rally (AR), secondary tests (ST), and springs
- Mark Up: Detects sustained uptrend with higher highs/higher lows structure
- Distribution: Recognizes buying climax (BC), UTAD (upthrust after distribution), and range formation
- Mark Down: Confirms breakdown with volume and downtrend structure
🎨 Visual Elements
- Phase Background Colors: Optional color-coded backgrounds for each phase
- Range Lines: Dynamic support/resistance levels during accumulation and distribution
- Event Markers: Clear labels for Spring, UTAD, JTC (Jump the Creek), and breakdowns
- Trend MA Overlay: Moving average for trend confirmation
- Phase Labels: Large, descriptive labels when phases change
📊 Dashboard
- Real-time phase status
- Volume climax indicator
- Event counters (Spring, UTAD, JTC)
- Customizable position and size
🔔 Alerts
- Phase change notifications
- Spring detection
- UTAD detection
- Jump the Creek confirmation
- Breakdown signals
━━━━━━━━━━━━━━━━━━━━━━━━━━━━━━━━━━━━━━━━
⚙️ CONFIGURATION
Wyckoff Phases (Main Settings)
Parameter | Default | Description
---------------------------- | ------- | -------------
Trend MA Length | 50 | Moving average for trend detection
Volume Climax Threshold | 1.5 | Multiplier for average volume to detect climax events
Range Detection Length | 14 | Lookback period for range identification
Phase 1: Accumulation
- Toggle accumulation phase display
- Show/hide Spring events
- Show/hide AR (Automatic Rally) and ST (Secondary Test)
- Customize phase and spring colors
Phase 2: Mark Up
- Toggle mark up phase display
- Show/hide Jump The Creek (JTC) events
- Customize phase and JTC colors
Phase 3: Distribution
- Toggle distribution phase display
- Show/hide UTAD events
- Show/hide BC (Buying Climax)
- Customize phase and UTAD colors
Phase 4: Mark Down
- Toggle mark down phase display
- Customize phase and breakdown colors
Visual Settings
- Show Phase Labels: Display large phase transition labels
- Show Event Markers: Display Spring, UTAD, JTC markers
- Show Phase Background: Color-code background by current phase
Dashboard
- Show Dashboard: Toggle statistics panel
- Position: Top Right / Bottom Right / Bottom Left
- Size: Tiny / Small / Normal
━━━━━━━━━━━━━━━━━━━━━━━━━━━━━━━━━━━━━━━━
🧠 HOW IT WORKS
Phase Detection Logic
1️⃣ Accumulation (Cause)
Triggers:
- Selling climax detected (high volume + down move)
- Price enters range-bound consolidation
- Low volume compression
- Spring: False breakdown below support with low volume
2️⃣ Mark Up (Effect)
Triggers:
- Jump The Creek (JTC): Breakout from accumulation range
- Volume confirms breakout (>1.3x average)
- Higher highs and higher lows structure
- Price above trend MA
3️⃣ Distribution (Cause)
Triggers:
- Buying climax detected (high volume + up move)
- Price enters range-bound consolidation after uptrend
- UTAD: False breakout above resistance with volume
- Range compression
4️⃣ Mark Down (Effect)
Triggers:
- Breakdown from distribution range
- Volume confirms breakdown (>1.3x average)
- Lower lows and lower highs structure
- Price below trend MA
━━━━━━━━━━━━━━━━━━━━━━━━━━━━━━━━━━━━━━━━
📝 EVENT DEFINITIONS
Event | Phase | Description | Visual
-------- | ------------- | ------------------------------------------------ | -------------------------
SC | Accumulation | Selling Climax - panic selling with high volume | Volume spike + price drop
AR | Accumulation | Automatic Rally - bounce from oversold | Recovery move
ST | Accumulation | Secondary Test - retest of lows | Low volume test
Spring | Accumulation | False breakdown below support | 🟢 Label below
JTC | Mark Up | Jump The Creek - confirmed breakout | 🔵 Label (transition)
BC | Distribution | Buying Climax - euphoric buying with high volume | Volume spike + price rise
UTAD | Distribution | Upthrust After Distribution - false breakout | 🟠 Label above
SOW | Mark Down | Sign of Weakness - confirmed breakdown | 🔴 Label (transition)
━━━━━━━━━━━━━━━━━━━━━━━━━━━━━━━━━━━━━━━━
🎯 USE CASES
For Traders
- Identify accumulation zones for potential long entries
- Recognize distribution zones for potential short entries or exits
- Confirm trend changes with phase transitions
- Avoid false breakouts (Springs and UTADs)
- Time entries using Jump The Creek signals
For Analysts
- Market structure analysis across multiple timeframes
- Volume-price divergence identification
- Institutional behavior tracking (accumulation/distribution)
- Cycle completion analysis
━━━━━━━━━━━━━━━━━━━━━━━━━━━━━━━━━━━━━━━━
🎨 RECOMMENDED SETTINGS
For Swing Trading (Daily/4H)
Trend MA Length: 50
Volume Climax Threshold: 1.5
Range Detection Length: 14
For Intraday Trading (1H/15m)
Trend MA Length: 20
Volume Climax Threshold: 2.0
Range Detection Length: 10
For Long-term Investors (Weekly)
Trend MA Length: 100
Volume Climax Threshold: 1.3
Range Detection Length: 20
━━━━━━━━━━━━━━━━━━━━━━━━━━━━━━━━━━━━━━━━
📚 WYCKOFF METHOD RESOURCES
The indicator is based on Richard Wyckoff's market cycle theory:
- Accumulation → Smart money accumulates while retail panics
- Mark Up → Price rises as smart money distributes to late buyers
- Distribution → Smart money exits while retail buys
- Mark Down → Price falls as retail holds losing positions
Learn More:
- Wyckoff Analytics
- Market cycle analysis
- Volume Spread Analysis (VSA)
━━━━━━━━━━━━━━━━━━━━━━━━━━━━━━━━━━━━━━━━
⚠️ IMPORTANT NOTES
- Volume Required: Indicator requires volume data (won't work on some Forex brokers without volume)
- Timeframe: Best results on 1H, 4H, Daily, Weekly
- Confirmation: Always combine with other analysis methods
- Context: Phase detection improves with clean, trending markets
━━━━━━━━━━━━━━━━━━━━━━━━━━━━━━━━━━━━━━━━
🐛 TROUBLESHOOTING
Q: Why aren't any phases showing?
- Ensure volume data is available for your symbol
- Try adjusting Volume Climax Threshold (lower = more sensitive)
- Check if Show Phase Background is enabled
Q: Too many false signals?
- Increase Volume Climax Threshold for stricter detection
- Increase Range Detection Length for better range identification
- Use higher timeframes (4H/Daily)
Q: Dashboard not showing?
- Check Show Dashboard is enabled in settings
- Ensure panel isn't off-screen (try different position)
━━━━━━━━━━━━━━━━━━━━━━━━━━━━━━━━━━━━━━━━
👨💻 CREDITS
Developer: Fxalgox
Method: Richard Wyckoff Market Cycle Theory
━━━━━━━━━━━━━━━━━━━━━━━━━━━━━━━━━━━━━━━━
💡 TIPS FOR BEST RESULTS
- Combine with Market Context: Use alongside market structure analysis
- Multi-timeframe Confirmation: Check higher timeframe phase alignment
- Volume is Key: Pay attention to volume climax indicators in dashboard
- Be Patient: Wait for phase confirmations before taking action
- Use Alerts: Set up alerts for phase changes and key events
━━━━━━━━━━━━━━━━━━━━━━━━━━━━━━━━━━━━━━━━
Happy Trading! 📈
Remember: This indicator is a tool for analysis, not financial advice. Always manage risk appropriately.
Mã được bảo vệ
Tập lệnh này được đăng dưới dạng mã nguồn đóng. Tuy nhiên, bạn có thể sử dụng tự do và không giới hạn – tìm hiểu thêm tại đây.
Thông báo miễn trừ trách nhiệm
Thông tin và các ấn phẩm này không nhằm mục đích, và không cấu thành, lời khuyên hoặc khuyến nghị về tài chính, đầu tư, giao dịch hay các loại khác do TradingView cung cấp hoặc xác nhận. Đọc thêm tại Điều khoản Sử dụng.