PROTECTED SOURCE SCRIPT
Cập nhật Super Signal - Bollinger Bands
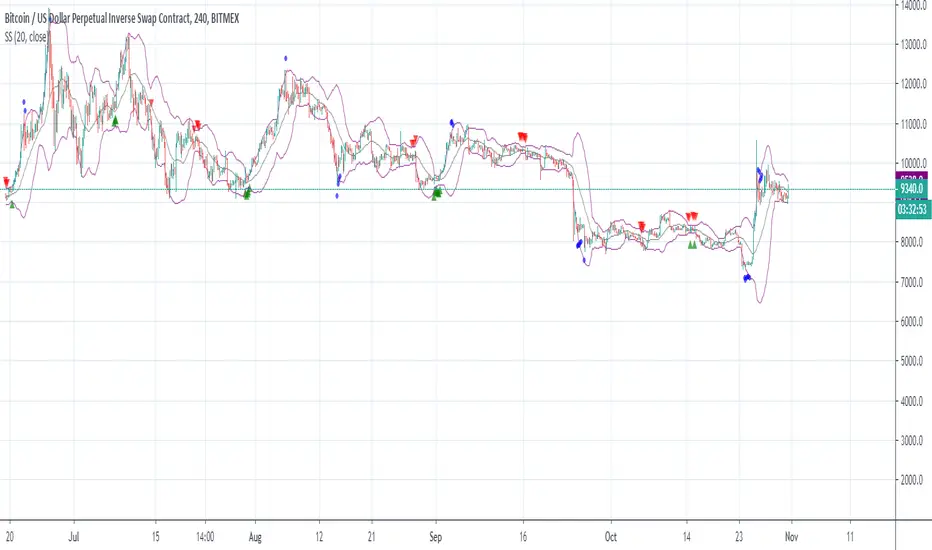
Bollinger Bands are price channels, or bands, that are plotted above and below price. The outer Bollinger Bands are based on price volatility, which means that they expand when the price fluctuates and trends strongly, and the Bands contract during sideways consolidations and low momentum trends. By using a combination of several indicators, we try to predict the direction of a large price movement when the Bands are compressed and the market is in a consolidation period.
To use the indicator:
Go long on the green arrows.
Go short on the red arrows.
The blue circles give a clear indication of when a trend has ended.
To use the indicator:
Go long on the green arrows.
Go short on the red arrows.
The blue circles give a clear indication of when a trend has ended.
Phát hành các Ghi chú
Slight adjustments to the algorithm have been made to improve signals.Phát hành các Ghi chú
Slight adjustments to improve signalsMã được bảo vệ
Tập lệnh này được đăng dưới dạng mã nguồn đóng. Tuy nhiên, bạn có thể sử dụng tự do và không giới hạn – tìm hiểu thêm tại đây.
Thông báo miễn trừ trách nhiệm
Thông tin và các ấn phẩm này không nhằm mục đích, và không cấu thành, lời khuyên hoặc khuyến nghị về tài chính, đầu tư, giao dịch hay các loại khác do TradingView cung cấp hoặc xác nhận. Đọc thêm tại Điều khoản Sử dụng.
Mã được bảo vệ
Tập lệnh này được đăng dưới dạng mã nguồn đóng. Tuy nhiên, bạn có thể sử dụng tự do và không giới hạn – tìm hiểu thêm tại đây.
Thông báo miễn trừ trách nhiệm
Thông tin và các ấn phẩm này không nhằm mục đích, và không cấu thành, lời khuyên hoặc khuyến nghị về tài chính, đầu tư, giao dịch hay các loại khác do TradingView cung cấp hoặc xác nhận. Đọc thêm tại Điều khoản Sử dụng.