PROTECTED SOURCE SCRIPT
GG [AYC]
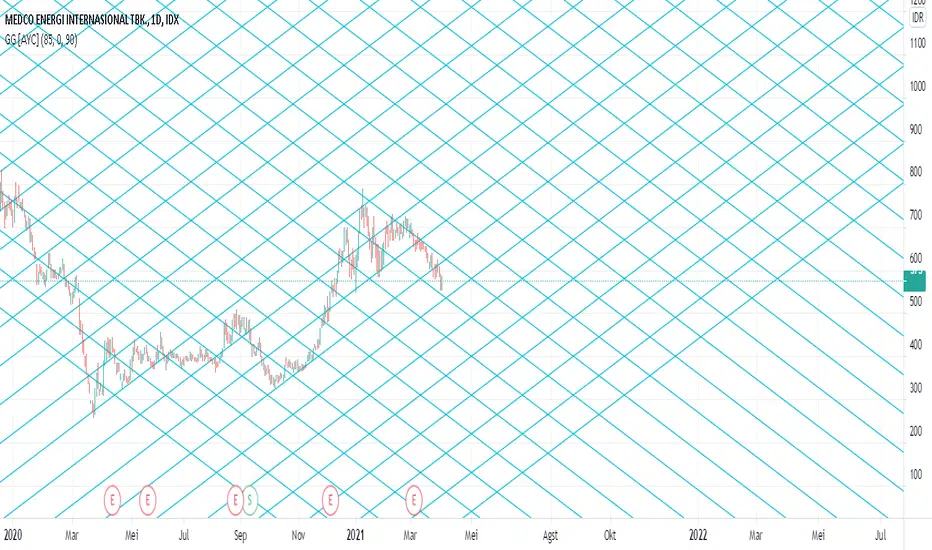
This indicator basically works like Gann Grid indicator that can be used as an SNR , making it easier to draw diagonal lines with the same price difference for each line.
The change in SNR in a market can be in the form of a certain gap/point number according to its characteristics.
Entering these numbers can make it easier for traders to determine SNR for better profit.
How to use :
1.Enter "Price" (Extreme Low)
2.Enter "Price Step" (It doesn't really important, just in case the line is not enough, because tradingview has limitations in plotting lines), Default is "0" & Step is "270"
3.Enter "Point" that you want as SNR , 90 is the default for the stock market.
4.Choose "Start"
Start = The start date of the cycle of price movements
5.Choose "End"
End = The end date of the cycle of price movements
Mã được bảo vệ
Tập lệnh này được đăng dưới dạng mã nguồn đóng. Tuy nhiên, bạn có thể sử dụng tự do và không giới hạn – tìm hiểu thêm tại đây.
Thông báo miễn trừ trách nhiệm
Thông tin và các ấn phẩm này không nhằm mục đích, và không cấu thành, lời khuyên hoặc khuyến nghị về tài chính, đầu tư, giao dịch hay các loại khác do TradingView cung cấp hoặc xác nhận. Đọc thêm tại Điều khoản Sử dụng.