PROTECTED SOURCE SCRIPT
Cập nhật Regularized Volume Zone Oscillator FSVZO
Regularized VZO
The Oscillator is build on Walid Khalil's and David Steckler's concept for leading volume oscillator.
Overview:
- FSVZO is a unique proprietary volume focused indicator, born from experimentation with leading indicator concepts, incorporating Fourier transformation for smoother and more responsive curvature, providing a statistical component to volume based logic. It leads price action, has clear divergences and provides re-entry points. It can Identify when the trend is losing momentum & strength.
- The statistical components in FSVZO equation helps to provides very smooth curvature of signal lines and responsiveness to overbought/oversold levels, that have similar efficiency even in parabolic trends. This and other factors make FSVZO stand out from similar volume based oscillators.
- The most striking feature of FSVZO - predicting trend shifts and reversals with sophisticated accuracy.
Structural Components
Band - Transforms price to a predictive curve that turns green or red depending on trend direction.
Red/green Colored Extremes - Visualizes areas that signal price reversals after the band reaches them, extreme points are marked with a green X or red arrows depending on trend direction.
Midline - Represents range middle.
Green/Red Bubbles - Represents FSVZO reversals.
White MA - This can be used as a discretional filter, after FSVZO crosses the MA it usually produces a directional impulse.
H/R - Stands for hidden and regular divergences, color represents trend, automated divergence detection is still in beta and might be clingy, the blue/orange bars on the price chart correlate with divergences.
Hue/Background Coloring - This acts as an alert for extremely overbought oversold conditions, it warns the user on not taking the position opposing the hue color, for example if it’s green, its warning you not to take short positions, if red not to take long positions.
Key Indications
Standalone Signal Generation
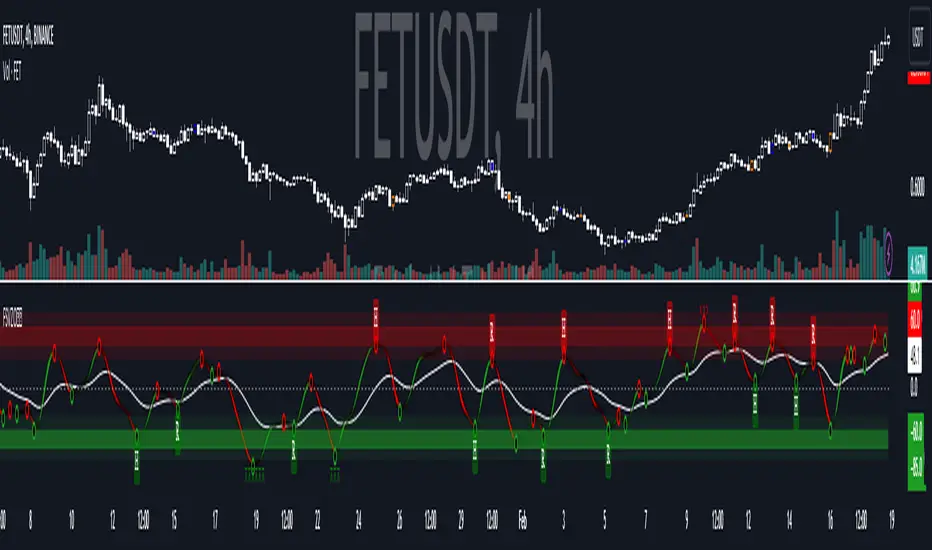
This chart provides a zoomed out view of the FSVZO oscillator, stripped of it’s more complex components and left with basic state.
FSVZO Signal Band
Intuitively color coded bi-colored signal band (or line), a core of FSVZO.
When the line goes up, price goes up. When the line goes down, price goes down. Curve peak points are relatively rare outside of extreme levels (marked as green/red horizontal bands) which makes it fast, predictive and predictable to use.
It produces decent divergences and entry points, it contextualizes future price direction for trend, while also detecting changes very quickly. It was originally built as a scalper system volume component.
Levels
Colored Extremes
FSVZO creates resistance and support levels, levels that likely to act as reversal points. They behave like price levels/pivots, or supply and demand zones traders usually use on price charts.
Levels can be used for predicting FSVZO reversals, for determining trend strength, used as take profit areas or re-entry areas. In short it paints active levels that FSVZO respects. Reaching them are relatively rare events.
Midline
The Midline separates bullish and bearish FSVZO bias, it’s marked by a dotted line in the middle of the oscillator at value of 0. It acts as a major S/R (support and resistance) line.
Chop (erratic directional changes, color flips, trend flips) is likely to occur in the oscillator and is reflected in price when the band moves between the midline (0 line) and the first colored extreme level. However it’s important to note when the band reverses and changes direction from an extreme level, chop is almost completely absent and trend is clean.
Trend Shift "Bubbles"
More than just directional change/band crossover.
The algorithm attempts to derive actionable, early & predictive trend change signals. It can also be used as a stand alone indicator - the green bubble means trend shift upwards, red means downwards.
Effectivity varies from location on indicator where the bubble was located and how healthy the signal band is.
MA Cross
The MA can be used as a discretional filter to filter out the trend direction. Following it produces some lag, but increases accuracy especially conditions prone to small chops.
Note: Events such as the FSVZO band crossing the MA, usually produces a directional impulse and is relatively rare.
The confirmation time is 1 bar.
Overbought & Oversold Alerts
Simply derived from band value and its interactions with extreme levels.
It prints symbols marked as red ྾ for bearish and green x for bullish placed below/above extreme levels depending on side of extreme.
It alerts the user about abnormal FSVZO and Market behavior, suggest reversals, and acts as a reminder to avoid high risk trades by entering into heavily abnormal conditions expecting the continuation.
It technically confirms theoretically correct entry signals the moment the alert stops printing, i.e. on first candle without an alert.
Note it's not advisable to enter a trade the moment you notice an alert, even if in most cases the first alert marks places of price reversal, or is very close to one. If you decide to use it as a reversal point without confirmation, it’s advisable to use confluences such as trend shifts, band flips or other oscillators/indicators.
Automatic Divergence Alerts Beta
Proprietary Divergence recognition engine.
Directional signals:
H for hidden; R for regular; Green for bullish; Red for bearish
Traditionally hidden divergences are used for continuation and regular for reversals. It’s advisable to draw divergences manually to avoid confirmation time and possible bugs.
It uses -1 lag.
White Noise Component
This is a complimentary component of the FSVZO system. Growing bars show increasing trend related activity, shrinking bars show weakening in the overall trend. The moment it crosses to the other side, for example it flips from upside bars to downside bars - it signals a reversal.
It’s advisable to use in confluence with the main oscillator. It was added to reduce the false positive rate and increase effectivity of the indicator.
H for hidden; R for regular; Green for bullish; Red for bearish
Traditionally hidden divergences are used for continuation and regular for reversals. It’s advisable to draw divergences manually to avoid confirmation time and possible bugs.
It uses -1 lag.
Background Hue
Similar to White noise, Hue (background highlighting) is independent to FSVZO component, it was added to provide confluences and increase indicator effectivity.
Green Hue - Alerts you about abnormal selling, appears in downtrend, suggesting to taking profits on short positions, look for long entries or avoid taking short positions in current conditions.
Red Hue - Alerts you about abnormal buying, appears in uptrend, suggests taking profits on long positions, look for short entries or abstain from entering long positions.
Hue provides high success rate trades when used in confluences alongside other FSVZO components.
The Oscillator is build on Walid Khalil's and David Steckler's concept for leading volume oscillator.
Overview:
- FSVZO is a unique proprietary volume focused indicator, born from experimentation with leading indicator concepts, incorporating Fourier transformation for smoother and more responsive curvature, providing a statistical component to volume based logic. It leads price action, has clear divergences and provides re-entry points. It can Identify when the trend is losing momentum & strength.
- The statistical components in FSVZO equation helps to provides very smooth curvature of signal lines and responsiveness to overbought/oversold levels, that have similar efficiency even in parabolic trends. This and other factors make FSVZO stand out from similar volume based oscillators.
- The most striking feature of FSVZO - predicting trend shifts and reversals with sophisticated accuracy.
Structural Components
Band - Transforms price to a predictive curve that turns green or red depending on trend direction.
Red/green Colored Extremes - Visualizes areas that signal price reversals after the band reaches them, extreme points are marked with a green X or red arrows depending on trend direction.
Midline - Represents range middle.
Green/Red Bubbles - Represents FSVZO reversals.
White MA - This can be used as a discretional filter, after FSVZO crosses the MA it usually produces a directional impulse.
H/R - Stands for hidden and regular divergences, color represents trend, automated divergence detection is still in beta and might be clingy, the blue/orange bars on the price chart correlate with divergences.
Hue/Background Coloring - This acts as an alert for extremely overbought oversold conditions, it warns the user on not taking the position opposing the hue color, for example if it’s green, its warning you not to take short positions, if red not to take long positions.
Key Indications
Standalone Signal Generation
This chart provides a zoomed out view of the FSVZO oscillator, stripped of it’s more complex components and left with basic state.
FSVZO Signal Band
Intuitively color coded bi-colored signal band (or line), a core of FSVZO.
When the line goes up, price goes up. When the line goes down, price goes down. Curve peak points are relatively rare outside of extreme levels (marked as green/red horizontal bands) which makes it fast, predictive and predictable to use.
It produces decent divergences and entry points, it contextualizes future price direction for trend, while also detecting changes very quickly. It was originally built as a scalper system volume component.
Levels
Colored Extremes
FSVZO creates resistance and support levels, levels that likely to act as reversal points. They behave like price levels/pivots, or supply and demand zones traders usually use on price charts.
Levels can be used for predicting FSVZO reversals, for determining trend strength, used as take profit areas or re-entry areas. In short it paints active levels that FSVZO respects. Reaching them are relatively rare events.
Midline
The Midline separates bullish and bearish FSVZO bias, it’s marked by a dotted line in the middle of the oscillator at value of 0. It acts as a major S/R (support and resistance) line.
Chop (erratic directional changes, color flips, trend flips) is likely to occur in the oscillator and is reflected in price when the band moves between the midline (0 line) and the first colored extreme level. However it’s important to note when the band reverses and changes direction from an extreme level, chop is almost completely absent and trend is clean.
Trend Shift "Bubbles"
More than just directional change/band crossover.
The algorithm attempts to derive actionable, early & predictive trend change signals. It can also be used as a stand alone indicator - the green bubble means trend shift upwards, red means downwards.
Effectivity varies from location on indicator where the bubble was located and how healthy the signal band is.
MA Cross
The MA can be used as a discretional filter to filter out the trend direction. Following it produces some lag, but increases accuracy especially conditions prone to small chops.
Note: Events such as the FSVZO band crossing the MA, usually produces a directional impulse and is relatively rare.
The confirmation time is 1 bar.
Overbought & Oversold Alerts
Simply derived from band value and its interactions with extreme levels.
It prints symbols marked as red ྾ for bearish and green x for bullish placed below/above extreme levels depending on side of extreme.
It alerts the user about abnormal FSVZO and Market behavior, suggest reversals, and acts as a reminder to avoid high risk trades by entering into heavily abnormal conditions expecting the continuation.
It technically confirms theoretically correct entry signals the moment the alert stops printing, i.e. on first candle without an alert.
Note it's not advisable to enter a trade the moment you notice an alert, even if in most cases the first alert marks places of price reversal, or is very close to one. If you decide to use it as a reversal point without confirmation, it’s advisable to use confluences such as trend shifts, band flips or other oscillators/indicators.
Automatic Divergence Alerts Beta
Proprietary Divergence recognition engine.
Directional signals:
H for hidden; R for regular; Green for bullish; Red for bearish
Traditionally hidden divergences are used for continuation and regular for reversals. It’s advisable to draw divergences manually to avoid confirmation time and possible bugs.
It uses -1 lag.
White Noise Component
This is a complimentary component of the FSVZO system. Growing bars show increasing trend related activity, shrinking bars show weakening in the overall trend. The moment it crosses to the other side, for example it flips from upside bars to downside bars - it signals a reversal.
It’s advisable to use in confluence with the main oscillator. It was added to reduce the false positive rate and increase effectivity of the indicator.
H for hidden; R for regular; Green for bullish; Red for bearish
Traditionally hidden divergences are used for continuation and regular for reversals. It’s advisable to draw divergences manually to avoid confirmation time and possible bugs.
It uses -1 lag.
Background Hue
Similar to White noise, Hue (background highlighting) is independent to FSVZO component, it was added to provide confluences and increase indicator effectivity.
Green Hue - Alerts you about abnormal selling, appears in downtrend, suggesting to taking profits on short positions, look for long entries or avoid taking short positions in current conditions.
Red Hue - Alerts you about abnormal buying, appears in uptrend, suggests taking profits on long positions, look for short entries or abstain from entering long positions.
Hue provides high success rate trades when used in confluences alongside other FSVZO components.
Phát hành các Ghi chú
Plotting Fixed and CompletePhát hành các Ghi chú
updated divergences Phát hành các Ghi chú
Updated PlottingUpdated Fourier Regularization of VZO
Phát hành các Ghi chú
updated plotsPhát hành các Ghi chú
Calculation UpdatedPhát hành các Ghi chú
fixed divergencesPhát hành các Ghi chú
Fixed area plot for OB/OS zonesPhát hành các Ghi chú
Complete Calculation Change and other minor things...Phát hành các Ghi chú
.....Phát hành các Ghi chú
Multi-Timeframe now works also
code cleaning
Phát hành các Ghi chú
Fixed Smoothing FunctionPhát hành các Ghi chú
1 Bar Offset Plot Fixed To Show FSVZO Strength, rather than simple band
Essentially the exact same now.
Mã được bảo vệ
Tập lệnh này được đăng dưới dạng mã nguồn đóng. Tuy nhiên, bạn có thể sử dụng tự do và không giới hạn – tìm hiểu thêm tại đây.
Check out whop.com/signals-suite for Access to Invite Only Scripts!
Thông báo miễn trừ trách nhiệm
Thông tin và các ấn phẩm này không nhằm mục đích, và không cấu thành, lời khuyên hoặc khuyến nghị về tài chính, đầu tư, giao dịch hay các loại khác do TradingView cung cấp hoặc xác nhận. Đọc thêm tại Điều khoản Sử dụng.