PROTECTED SOURCE SCRIPT
Megazones
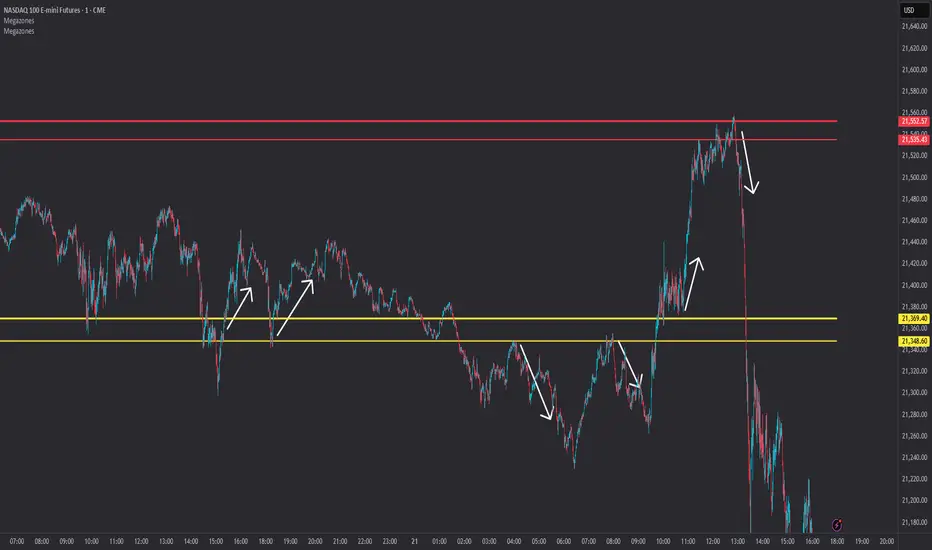
📦 Megazones — Auto-Expanding Range Detection
Megazones is a dynamic tool that detects price expansion ranges based on pivot structure. It automatically plots a pair of horizontal lines when both pivot highs and pivot lows are expanding — signaling directional strength and potential breakout zones.
🧠 How It Works:
- Pivot Detection: The script finds local highs/lows using a configurable Pivot Lookback length.
- Expansion Logic: It checks for consecutive higher highs and higher lows (configurable count).
- Zone Projection: When both expansions are detected, it draws a fading "zone" using two horizontal lines based on the latest pivot high and low.
⚙️ Settings:
- Pivot Lookback: How far left/right to confirm a pivot.
- Expansion Detection Window: How many bars back to keep pivots in memory.
- Min Expanding Highs/Lows: How many higher highs/lows must occur in a row to trigger zone detection.
🔍 Key Concept:
It identifies moments when the market is forming a structured expansion, where both higher highs and higher lows appear sequentially — suggesting potential breakout pressure or momentum continuation.
✅ Use Cases:
- Visual confirmation of building bullish structure.
- Anticipating breakout areas from clean expansion phases.
- Identifying trend-following continuation zones.
Mã được bảo vệ
Tập lệnh này được đăng dưới dạng mã nguồn đóng. Tuy nhiên, bạn có thể sử dụng tự do và không giới hạn – tìm hiểu thêm tại đây.
Thông báo miễn trừ trách nhiệm
Thông tin và các ấn phẩm này không nhằm mục đích, và không cấu thành, lời khuyên hoặc khuyến nghị về tài chính, đầu tư, giao dịch hay các loại khác do TradingView cung cấp hoặc xác nhận. Đọc thêm tại Điều khoản Sử dụng.