PINE LIBRARY
Strategy Utilities

This library comprises valuable functions for implementing strategies on TradingView, articulated in a professional writing style.
The initial version features a monthly Profit & Loss table with percentage variations, utilizing a modified version of the script by @QuantNomad.
Library "strategy_utilities"
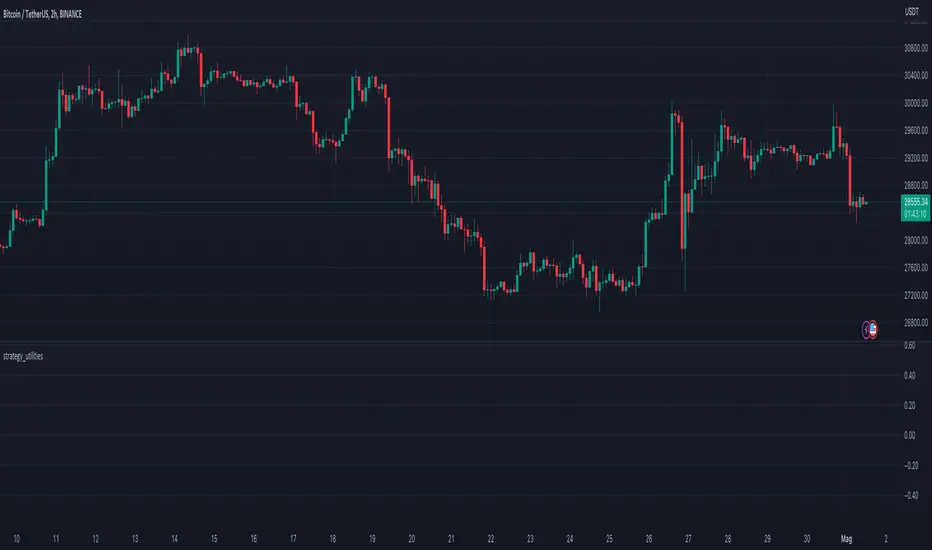
monthly_table(results_prec, results_dark)
monthly_table prints the Monthly Returns table, modified from QuantNomad. Please put calc_on_every_tick = true to plot it.
Parameters:
results_prec (int): for the precision for decimals
results_dark (bool): true or false to print the table in dark mode
Returns: nothing (void), but prints the monthly equity table
Sample Usage
import TheSocialCryptoClub/strategy_utilities/1 as su
results_prec = input(2, title = "Precision", group="Results Table")
results_dark = input.bool(defval=true, title="Dark Mode", group="Results Table")
su.monthly_table(results_prec, results_dark)
Thư viện Pine
Theo đúng tinh thần TradingView, tác giả đã công bố mã Pine này như một thư viện mã nguồn mở để các lập trình viên Pine khác trong cộng đồng có thể tái sử dụng. Chúc mừng tác giả! Bạn có thể sử dụng thư viện này cho mục đích cá nhân hoặc trong các ấn phẩm mã nguồn mở khác, nhưng việc tái sử dụng mã này trong các ấn phẩm phải tuân theo Nội Quy.
- Scalping The Bull Indicator: linktr.ee/scalpingthebull
- Scalping The Bull Training: tinyurl.com/corsoindicatorepro
- AlgoTrading Training: tiny.one/corsopinescriptbase
- Crypto News: t.me/joinchat/StkXJM
- Scalping The Bull Training: tinyurl.com/corsoindicatorepro
- AlgoTrading Training: tiny.one/corsopinescriptbase
- Crypto News: t.me/joinchat/StkXJM
Thông báo miễn trừ trách nhiệm
Thông tin và các ấn phẩm này không nhằm mục đích, và không cấu thành, lời khuyên hoặc khuyến nghị về tài chính, đầu tư, giao dịch hay các loại khác do TradingView cung cấp hoặc xác nhận. Đọc thêm tại Điều khoản Sử dụng.