PROTECTED SOURCE SCRIPT
Cập nhật Rs Candlestick Indicator With Moving Averages
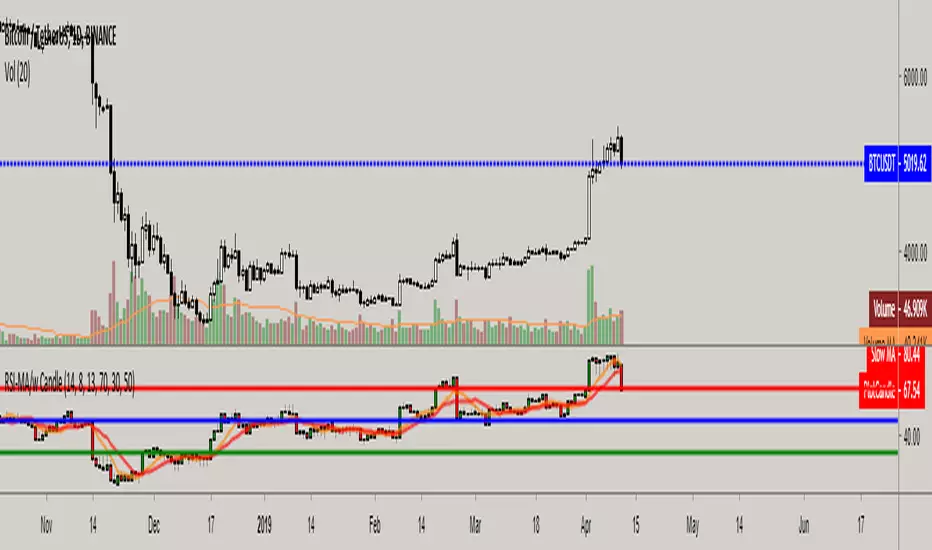
Unlike the traditional RSI, this one offers you an detailed insight with candlestick chart, rather than a simple line setup. It also includes two different customizable moving average(s) and offers detailed information such as bullish/bearish candlestick formations, negative and positive divergences on indicator.
How to use: Similar to candlestick charts, whenever Rsi candle close and stays above moving average(s) it's a buy signal and whenever candle closes below moving average(s), that's a sell signal. Rather than waiting for Rsi to break mid-line(50) to buy and sell, this one offers dynamic and more accurate buy and sell signals. You can also customize top-mid-bottom line values as well to determine overbought and oversold levels.
How to use: Similar to candlestick charts, whenever Rsi candle close and stays above moving average(s) it's a buy signal and whenever candle closes below moving average(s), that's a sell signal. Rather than waiting for Rsi to break mid-line(50) to buy and sell, this one offers dynamic and more accurate buy and sell signals. You can also customize top-mid-bottom line values as well to determine overbought and oversold levels.
Phát hành các Ghi chú
Added mid-line color.Mã được bảo vệ
Tập lệnh này được đăng dưới dạng mã nguồn đóng. Tuy nhiên, bạn có thể sử dụng tự do và không giới hạn – tìm hiểu thêm tại đây.
Thông báo miễn trừ trách nhiệm
Thông tin và các ấn phẩm này không nhằm mục đích, và không cấu thành, lời khuyên hoặc khuyến nghị về tài chính, đầu tư, giao dịch hay các loại khác do TradingView cung cấp hoặc xác nhận. Đọc thêm tại Điều khoản Sử dụng.
Mã được bảo vệ
Tập lệnh này được đăng dưới dạng mã nguồn đóng. Tuy nhiên, bạn có thể sử dụng tự do và không giới hạn – tìm hiểu thêm tại đây.
Thông báo miễn trừ trách nhiệm
Thông tin và các ấn phẩm này không nhằm mục đích, và không cấu thành, lời khuyên hoặc khuyến nghị về tài chính, đầu tư, giao dịch hay các loại khác do TradingView cung cấp hoặc xác nhận. Đọc thêm tại Điều khoản Sử dụng.