OPEN-SOURCE SCRIPT
Anchored VWAP Polyline [CHE]
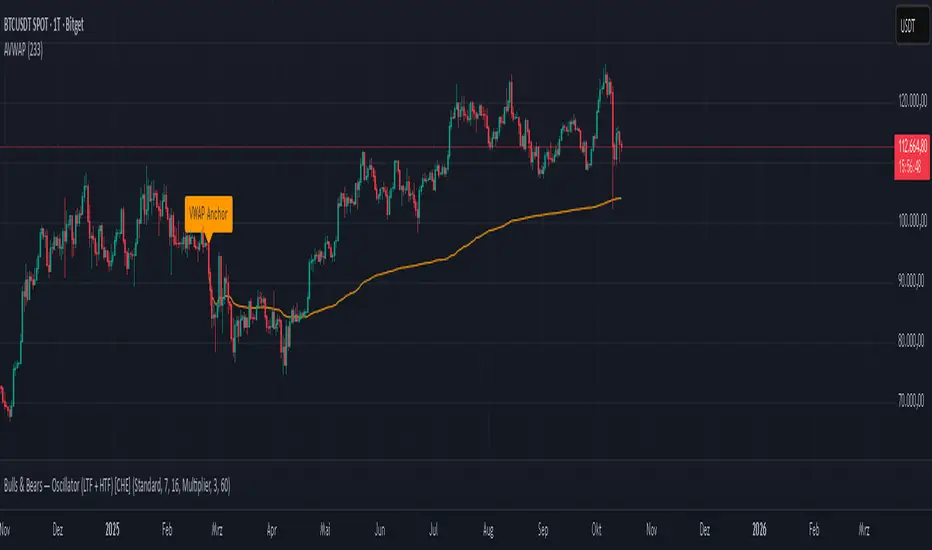
Anchored VWAP Polyline [CHE] — Anchored VWAP drawn as a polyline from a user-defined bar count with last-bar updates and optional labels
Summary
This indicator renders an anchored Volume-Weighted Average Price as a continuous polyline starting from a user-selected anchor point a specified number of bars back. It accumulates price multiplied by volume only from the anchor forward and resets cleanly when the anchor moves. Drawing is object-based (polyline and labels) and updated on the most recent bar only, which reduces flicker and avoids excessive redraws. Optional labels mark the anchor and, conditionally, a delta label when the current close is below the historical close at the anchor offset.
Motivation: Why this design?
Anchored VWAP is often used to track fair value after a specific event such as a swing, breakout, or session start. Traditional plot-based lines can repaint during live updates or incur overhead when frequently redrawn. This implementation focuses on explicit state management, last-bar rendering, and object recycling so the line stays stable while remaining responsive when the anchor changes. The design emphasizes deterministic updates and simple session gating from the anchor.
What’s different vs. standard approaches?
Baseline: Classic VWAP lines plotted from session open or full history.
Architecture differences:
Anchor defined by a fixed bar offset rather than session or day boundaries.
Object-centric drawing via `polyline` with an array of `chart.point` objects.
Last-bar update pattern with deletion and replacement of the polyline to apply all points cleanly.
Conditional labels: an anchor marker and an optional delta label only when the current close is below the historical close at the offset.
Practical effect: You get a visually continuous anchored VWAP that resets when the anchor shifts and remains clean on chart refreshes. The labels act as lightweight diagnostics without clutter.
How it works (technical)
The anchor index is computed as the latest bar index minus the user-defined bar count.
A session flag turns true from the anchor forward; prior bars are excluded.
Two persistent accumulators track the running sum of price multiplied by volume and the running sum of volume; they reset when the session flag turns from false to true.
The anchored VWAP is the running sum divided by the running volume whenever both are valid and the volume is not zero.
Points are appended to an array only when the anchored VWAP is valid. On the most recent bar, any existing polyline is deleted and replaced with a new one built from the point array.
Labels are refreshed on the most recent bar:
A yellow warning label appears when there are not enough bars to compute the reference values.
The anchor label marks the anchor bar.
The delta label appears only when the current close is below the close at the anchor offset; otherwise it is suppressed.
No higher-timeframe requests are used; repaint is limited to normal live-bar behavior.
Parameter Guide
Bars back — Sets the anchor offset in bars; default two hundred thirty-three; minimum one. Larger values extend the anchored period and increase stability but respond more slowly to regime changes.
Labels — Toggles all labels; default enabled. Disable to keep the chart clean when using multiple instances.
Reading & Interpretation
The polyline represents the anchored VWAP from the chosen anchor to the current bar. Price above the line suggests strength relative to the anchored baseline; price below suggests weakness.
The anchor label shows where the accumulation starts.
The delta label appears only when today’s close is below the historical close at the offset; it provides a quick context for negative drift relative to that reference.
A yellow message at the current bar indicates the chart does not have enough history to compute the reference comparison yet.
Practical Workflows & Combinations
Trend following: Anchor after a breakout bar or a swing confirmation. Use the anchored VWAP as dynamic support or resistance; look for clean retests and holds for continuation.
Mean reversion: Anchor at a local extreme and watch for approaches back toward the line; require structure confirmation to avoid early entries.
Session or event studies: Re-set the anchor around earnings, macro releases, or session opens by adjusting the bar offset.
Combinations: Pair with structure tools such as swing highs and lows, or with volatility measures to filter chop. The labels can be disabled when combining multiple instances to maintain chart clarity.
Behavior, Constraints & Performance
Repaint and confirmation: The line is updated on the most recent bar only; historical values do not rely on future bars. Normal live-bar movement applies until the bar closes.
No higher timeframe: There is no `security` call; repaint paths related to higher-timeframe lookahead do not apply here.
Resources: Uses one polyline object that is rebuilt on the most recent bar, plus two labels when conditions are met. `max_bars_back` is two thousand. Arrays store points from the anchor forward; extremely long anchors or very long charts increase memory usage.
Known limits: With very thin volume, the VWAP can be unavailable for some bars. Very large anchors reduce responsiveness. Labels use ATR for vertical placement; extreme gaps can place them close to extremes.
Sensible Defaults & Quick Tuning
Starting point: Bars back two hundred thirty-three with Labels enabled works well on many assets and timeframes.
Too noisy around the line: Increase Bars back to extend the accumulation window.
Too sluggish after regime changes: Decrease Bars back to focus on a shorter anchored period.
Chart clutter with multiple instances: Disable Labels while keeping the polyline visible.
What this indicator is—and isn’t
This is a visualization of an anchored VWAP with optional diagnostics. It is not a full trading system and does not include entries, exits, or position management. Use it alongside clear market structure, risk controls, and a plan for trade management. It does not predict future prices.
Inputs with defaults
Bars back: two hundred thirty-three bars, minimum one.
Labels: enabled or disabled toggle, default enabled.
Pine version: v6
Overlay: true
Primary outputs: one polyline, optional labels (anchor, conditional delta, and a warning when insufficient bars).
Metrics and functions: volume, ATR for label offset, object drawing via polyline and chart points, last-bar update pattern.
Special techniques: session gating from the anchor, persistent state, object recycling, explicit guards against unavailable values and zero volume.
Compatibility and assets: Designed for standard candlestick or bar charts across liquid assets and common timeframes.
Diagnostics: Yellow warning label when history is insufficient.
Disclaimer
The content provided, including all code and materials, is strictly for educational and informational purposes only. It is not intended as, and should not be interpreted as, financial advice, a recommendation to buy or sell any financial instrument, or an offer of any financial product or service. All strategies, tools, and examples discussed are provided for illustrative purposes to demonstrate coding techniques and the functionality of Pine Script within a trading context.
Any results from strategies or tools provided are hypothetical, and past performance is not indicative of future results. Trading and investing involve high risk, including the potential loss of principal, and may not be suitable for all individuals. Before making any trading decisions, please consult with a qualified financial professional to understand the risks involved.
By using this script, you acknowledge and agree that any trading decisions are made solely at your discretion and risk.
Do not use this indicator on Heikin-Ashi, Renko, Kagi, Point-and-Figure, or Range charts, as these chart types can produce unrealistic results for signal markers and alerts.
Best regards and happy trading
Chervolino
Mã nguồn mở
Theo đúng tinh thần TradingView, tác giả của tập lệnh này đã công bố nó dưới dạng mã nguồn mở, để các nhà giao dịch có thể xem xét và xác minh chức năng. Chúc mừng tác giả! Mặc dù bạn có thể sử dụng miễn phí, hãy nhớ rằng việc công bố lại mã phải tuân theo Nội quy.
Thông báo miễn trừ trách nhiệm
Thông tin và các ấn phẩm này không nhằm mục đích, và không cấu thành, lời khuyên hoặc khuyến nghị về tài chính, đầu tư, giao dịch hay các loại khác do TradingView cung cấp hoặc xác nhận. Đọc thêm tại Điều khoản Sử dụng.