PROTECTED SOURCE SCRIPT
Top 5 Trend [KintsugiTrading]
Top 5 Trend [KintsugiTrading]
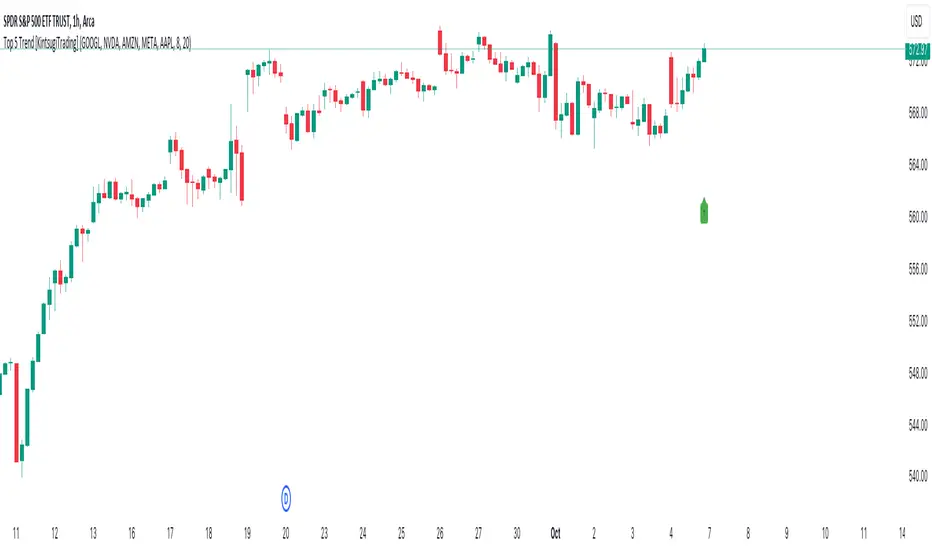
This script provides a visual indicator for tracking the average trend of five selected stocks. By calculating the exponential moving average (EMA) of the closing price of the five selected stocks, the indicator helps users quickly assess overall market sentiment. The indicator's original purpose was to inform the user of the direction of the five largest stocks that make up ~25% of the S&P 500.
Key Features:
This indicator is perfect for traders who want to monitor the combined movement of a group of major stocks in order to easily compare strengths or weaknesses. It is a key visual aid in understanding if the overall sentiment is bullish or bearish based on the selected stocks' performance, thus making sure the user is always trading on the right side of momentum.
This script provides a visual indicator for tracking the average trend of five selected stocks. By calculating the exponential moving average (EMA) of the closing price of the five selected stocks, the indicator helps users quickly assess overall market sentiment. The indicator's original purpose was to inform the user of the direction of the five largest stocks that make up ~25% of the S&P 500.
Key Features:
- Custom Stock Selection: Choose any five stocks to monitor and visualize their combined trend.
- EMA-Based Trend: The indicator compares a fast and slow EMA to determine the direction of the trend. When the fast EMA is above the slow EMA, the trend is considered bullish (uptrend); otherwise, it's bearish (downtrend).
- Customizable Colors: You can easily customize the colors for both uptrends and downtrends, giving you control over the visual representation of the trend.
- Trend Bar Display: For an easy, sleek, and simple reference - The script displays a trend arrow in the lower-right corner of the chart for bullish momentum and a trend arrow in the top-right corner of the chart for bearish momentum.
This indicator is perfect for traders who want to monitor the combined movement of a group of major stocks in order to easily compare strengths or weaknesses. It is a key visual aid in understanding if the overall sentiment is bullish or bearish based on the selected stocks' performance, thus making sure the user is always trading on the right side of momentum.
Mã được bảo vệ
Tập lệnh này được đăng dưới dạng mã nguồn đóng. Tuy nhiên, bạn có thể sử dụng tự do và không giới hạn – tìm hiểu thêm tại đây.
- Jay -
KintsugiTrading@gmail.com
KintsugiTrading.com
KintsugiTrading@gmail.com
KintsugiTrading.com
Thông báo miễn trừ trách nhiệm
Thông tin và các ấn phẩm này không nhằm mục đích, và không cấu thành, lời khuyên hoặc khuyến nghị về tài chính, đầu tư, giao dịch hay các loại khác do TradingView cung cấp hoặc xác nhận. Đọc thêm tại Điều khoản Sử dụng.