PROTECTED SOURCE SCRIPT
Delta Histogram - OnlyFlow
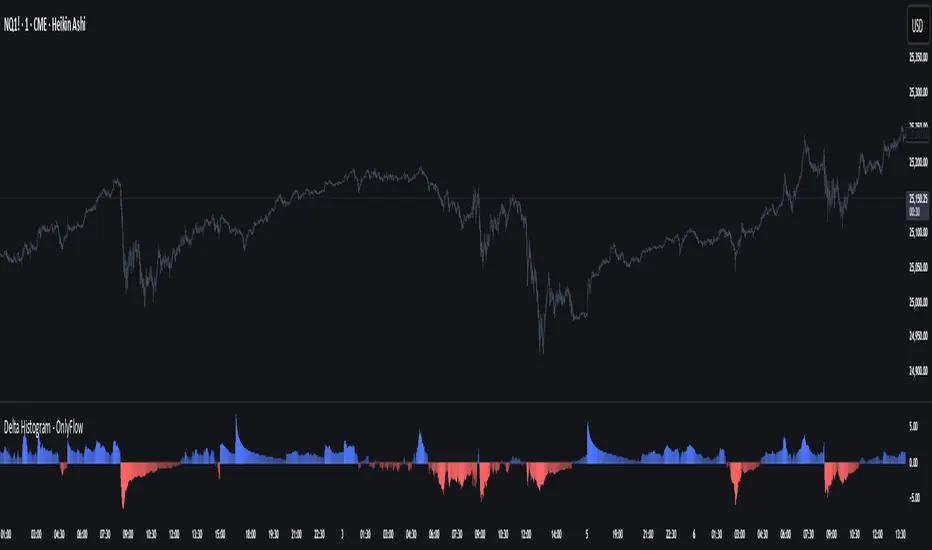
This script plots a histogram of delta proxies (approximations of buying vs. selling pressure) using available chart data. Because TradingView does not provide bid/ask tape data, delta is estimated with several selectable methods:
Uptick/Down-tick (proxy): volume signed by close direction.
Body-weighted Volume: weights volume by candle body relative to its range.
VWAP-slope Volume: signs volume by changes in the typical price (HLC3).
Features
Cumulative or per-bar mode: reset daily or by custom session hours.
Normalization options: Z-score, percentile scaling, or raw values; with percentile clipping for stable colors and axis scaling.
Visualization: color-coded positive/negative bars, optional zero line and ± bands, adjustable opacity scaling.
Readout Panel: shows the latest delta values and their normalized equivalents on the chart edge.
Alerts: triggers when normalized delta exceeds positive or negative thresholds, highlighting potential spikes in pressure.
Usage
Switch between delta modes to explore different perspectives on order-flow imbalance. Cumulative mode shows whether pressure builds over a session, while per-bar mode highlights bar-to-bar shifts. Normalization helps identify relative extremes in context rather than raw values.
Mã được bảo vệ
Tập lệnh này được đăng dưới dạng mã nguồn đóng. Tuy nhiên, bạn có thể sử dụng tự do và không giới hạn – tìm hiểu thêm tại đây.
Thông báo miễn trừ trách nhiệm
Thông tin và các ấn phẩm này không nhằm mục đích, và không cấu thành, lời khuyên hoặc khuyến nghị về tài chính, đầu tư, giao dịch hay các loại khác do TradingView cung cấp hoặc xác nhận. Đọc thêm tại Điều khoản Sử dụng.