OPEN-SOURCE SCRIPT
Cập nhật Sessions on Chart
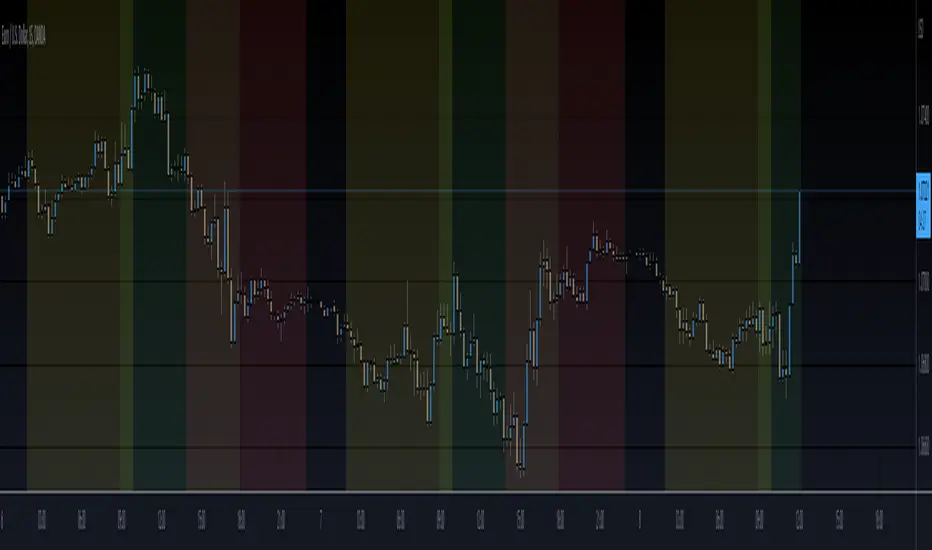
This script shows the London and NY Sessions on your chart. Decided to publish it on demand for user yuan642 :D. Maybe other users may find it helpful.
Looking back on charts it can help to spot certain moves or patterns around certain Session open when high volumes enter the markets.
Looking back on charts it can help to spot certain moves or patterns around certain Session open when high volumes enter the markets.
Phát hành các Ghi chú
The script has been updated with the following features:- Tokyo Session
- the background is colored for each session between highs and lows of timeframe chosen (D, W, M).
Examples of this indicator calculated with highs and lows for each session on daily, weekly and monthly basis, respectively:
https://www.tradingview.com/x/Spo0RHf1/
https://www.tradingview.com/x/cY1IHCdd/
https://www.tradingview.com/x/rcEMwBWN/
View only of the sessions with highs and lows calculated on daily timeframe:
https://www.tradingview.com/x/dzDCE3Hd/
Hope you enjoy the update!
Phát hành các Ghi chú
The script has been updated with the following features:- Tokyo Session
- the background is colored for each session between highs and lows of timeframe chosen (D, W, M).
Phát hành các Ghi chú
- After getting messages from users that they prefer the previous background view, I have changed to the previous view by default with Asia Session extra. - The new features with highs and lows can be activated in the settings.
Phát hành các Ghi chú
- After getting messages from users that they prefer the previous background view, I have changed to the previous view by default with Asia Session extra. - The new features with highs and lows can be activated in the settings.
Phát hành các Ghi chú
- Manage the plotted sessions by ticking in the settings.
- Sydney session added as well.
Phát hành các Ghi chú
- Manage the plotted sessions by ticking in the settings.
- Aussie session added as well.
Phát hành các Ghi chú
Fixed minor mistakes.Phát hành các Ghi chú
Corrected minor mistakesPhát hành các Ghi chú
Fixes the blue boxes issues.Phát hành các Ghi chú
Changed the script back to how it was before the pine process issues.Phát hành các Ghi chú
The change in behavior on weekends due to the new version upgrade has been mitigated.Phát hành các Ghi chú
In the High/Low View, each session does not start with the previous session's range anymore. The new update eliminates the "spikes" from the chart.Phát hành các Ghi chú
- Updated the script to the Pine Script v5 version- Solved the issue of Timezone Differences
Mã nguồn mở
Theo đúng tinh thần TradingView, tác giả của tập lệnh này đã công bố nó dưới dạng mã nguồn mở, để các nhà giao dịch có thể xem xét và xác minh chức năng. Chúc mừng tác giả! Mặc dù bạn có thể sử dụng miễn phí, hãy nhớ rằng việc công bố lại mã phải tuân theo Nội quy.
Thông báo miễn trừ trách nhiệm
Thông tin và các ấn phẩm này không nhằm mục đích, và không cấu thành, lời khuyên hoặc khuyến nghị về tài chính, đầu tư, giao dịch hay các loại khác do TradingView cung cấp hoặc xác nhận. Đọc thêm tại Điều khoản Sử dụng.