OPEN-SOURCE SCRIPT
Cập nhật Table rsi multiframes(by Lc_M)
- Simultaneous display of RSI values on cells corresponding to each selected timeframe, organized in an intuitive table, adjustable in size and position.
- Color indicator on each cell that presents RSI values within the overbought and oversold levels. example: if the user wants to set the O.S/O.B levels to 20 - 80, the colored cells will only appear at "RSI" => 80 and "RSI" <= 20.
- Free configuration of graphic times, lengths and O.B/O.S, according to user standards
Phát hành các Ghi chú
Bug fixPhát hành các Ghi chú
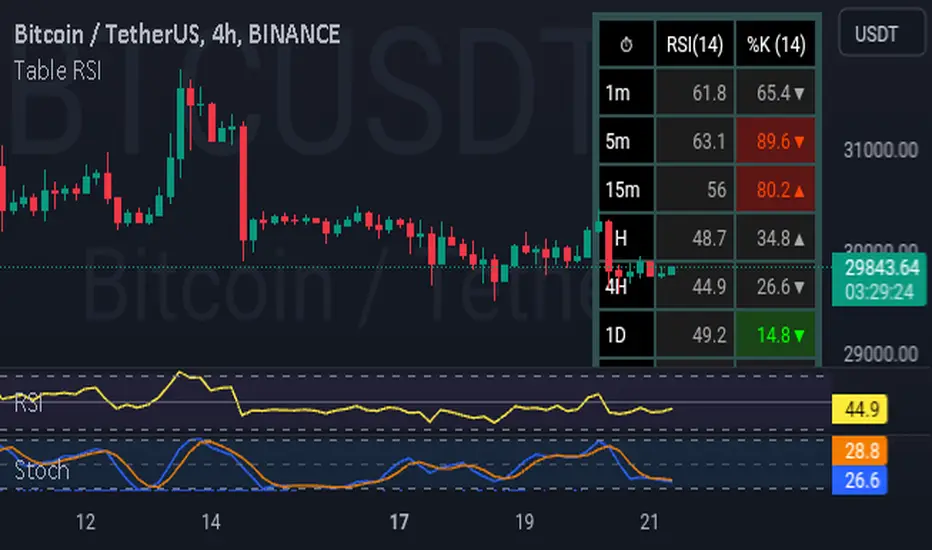
This table groups together a set of values referring to the RSI of each selected timeframe so that the user can follow them simultaneously.And to serve users who seek a more refined analysis, especially in the short term, a new column was implemented in this upgrade, containing the values of the stochastic indicator.
Check the Feat:
► Table with size and position adjustment, and selection of up to 7 different timeframes.
► COLUMN RSI: displays the values corresponding to each TF, allowing the user to adjust the length and font.
► COLOR INDICATOR ABOUT THE CELL: as the RSI reaches overbought/oversold levels, the cells tend to change their colors to red (RSI >= O.B) or green (RSI <= O.S), whatever the chart period.
((NOTE)): The O.B/O.S standards can be modified by the user, the color indicator automatically adapts to the established standards.
UPDATES:
•►► ENABLE/DISABLE TIMEFRAME: allows the user to keep a smaller amount of TF to be displayed in the table, as desired.
•►► STOCHASTIC OSCILLATOR : column with stochastic oscillator values for short-term analysis, with adjustments for %K Length, %K Smooth and %D values.
•►► COLOR INDICATOR ABOUT CELL: The functionality applied to RSI values is also applicable to stochastic values. It is worth mentioning that the adjustments of one do not interfere with the other, each one is individually adjustable.
•►► DIRECTIONAL ARROW: applicable only to the Stochastic column, this function informs the user when the value of line %K is above or below the value of line %D.
Mã nguồn mở
Theo đúng tinh thần TradingView, tác giả của tập lệnh này đã công bố nó dưới dạng mã nguồn mở, để các nhà giao dịch có thể xem xét và xác minh chức năng. Chúc mừng tác giả! Mặc dù bạn có thể sử dụng miễn phí, hãy nhớ rằng việc công bố lại mã phải tuân theo Nội quy.
Thông báo miễn trừ trách nhiệm
Thông tin và các ấn phẩm này không nhằm mục đích, và không cấu thành, lời khuyên hoặc khuyến nghị về tài chính, đầu tư, giao dịch hay các loại khác do TradingView cung cấp hoặc xác nhận. Đọc thêm tại Điều khoản Sử dụng.