OPEN-SOURCE SCRIPT
BB Running Away Candle
Hello,
here is an indicator that can be helpful for your trading that is simple and easy to use.
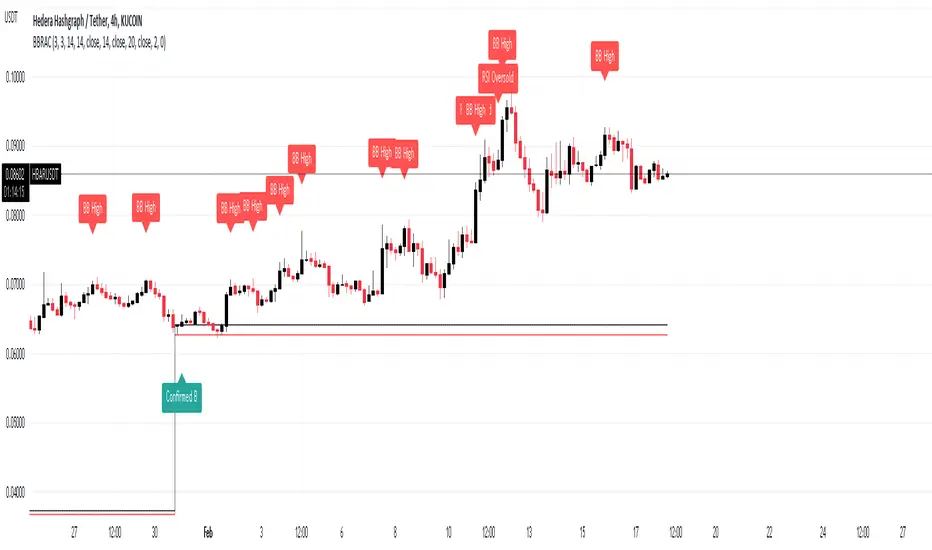
Our culprit here is a candle that opens and closes below the lower band of Bollinger Band, Black and red lines are put on the high and low of that candle.
Green Arrows are happening when:
1- When candle closes above the black line [the high of culprit candle] and Stochastic RSI is in the oversold area >> "Confirmed B"
2- When candle closes above the black line[the high of culprit candle] >> "B"
Note that you can choose from the settings whether you want it confirmed or not.
Red Arrows are happening when:
1- Price reached the higher band of Bollinger Bands >> "BB High"
2- Stochastic crosses down from above 80 level >> "Stoch Crossdown"
3- RSI reached above 70 levle >> "RSI Oversold"
Note that you can choose to turn these on or off from the settings.
Settings of indicators are set to default.
NOTE: Alerts are put there however i didn't get the chance to test them, so would like to hear your feedback about them.
THE USE OF THIS INDICATOR IS YOUR OWN RESPONSIBILITY.
wishing you the best.
here is an indicator that can be helpful for your trading that is simple and easy to use.
Our culprit here is a candle that opens and closes below the lower band of Bollinger Band, Black and red lines are put on the high and low of that candle.
Green Arrows are happening when:
1- When candle closes above the black line [the high of culprit candle] and Stochastic RSI is in the oversold area >> "Confirmed B"
2- When candle closes above the black line[the high of culprit candle] >> "B"
Note that you can choose from the settings whether you want it confirmed or not.
Red Arrows are happening when:
1- Price reached the higher band of Bollinger Bands >> "BB High"
2- Stochastic crosses down from above 80 level >> "Stoch Crossdown"
3- RSI reached above 70 levle >> "RSI Oversold"
Note that you can choose to turn these on or off from the settings.
Settings of indicators are set to default.
NOTE: Alerts are put there however i didn't get the chance to test them, so would like to hear your feedback about them.
THE USE OF THIS INDICATOR IS YOUR OWN RESPONSIBILITY.
wishing you the best.
Mã nguồn mở
Theo đúng tinh thần TradingView, tác giả của tập lệnh này đã công bố nó dưới dạng mã nguồn mở, để các nhà giao dịch có thể xem xét và xác minh chức năng. Chúc mừng tác giả! Mặc dù bạn có thể sử dụng miễn phí, hãy nhớ rằng việc công bố lại mã phải tuân theo Nội quy.
Thông báo miễn trừ trách nhiệm
Thông tin và các ấn phẩm này không nhằm mục đích, và không cấu thành, lời khuyên hoặc khuyến nghị về tài chính, đầu tư, giao dịch hay các loại khác do TradingView cung cấp hoặc xác nhận. Đọc thêm tại Điều khoản Sử dụng.