OPEN-SOURCE SCRIPT
MTF ADX & DI - Monitoring Panel
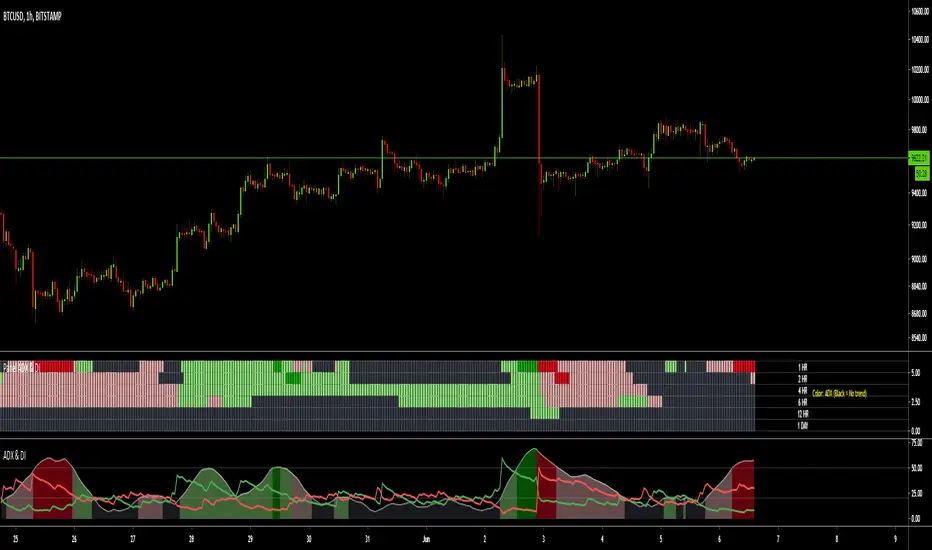
Monitoring panel showing the ADX (Average Directional Index) & DMI (Directional Movement Index) as color code for 6 different timeframes.
This gives a very easy overview on the current state of the market and if it is trending.
- ADX basically describes the strength of a Trend
- DMI give indication on the direction of the trend, usually shown as +DI and -DI
Meanings of the Colors:
ADX is below Low Threshold (no trend) : Black
ADX is above Low Threshold and DI is positive (weak bullish trend) : Light Green
ADX is above High Threshold and DI is positive (strong bullish trend) : Dark Green
ADX is above Low Threshold and DI is negative (weak bearish trend) : Light Red
ADX is above High Threshold and DI is negative (strong bearish trend) : Dark Red
- Low Threshold (default = 20) and High Threshold (default = 50) can be changed in the settings
- Timeframes can be changed, but the description labels are currently hardcoded - if you want to change it, just copy the script and change them
- Currently there are two additional timeframes commented in the code - if you want to use them, just copy the script and uncomment them
Have fun and as always I am open for constructive feedback.
Cheers!
Mã nguồn mở
Theo đúng tinh thần TradingView, tác giả của tập lệnh này đã công bố nó dưới dạng mã nguồn mở, để các nhà giao dịch có thể xem xét và xác minh chức năng. Chúc mừng tác giả! Mặc dù bạn có thể sử dụng miễn phí, hãy nhớ rằng việc công bố lại mã phải tuân theo Nội quy.
The new Order Block Finder V2 is available as invite-only script. Please visit the website for all the details and how to get access:
sites.google.com/view/wugamlo-indicators/
sites.google.com/view/wugamlo-indicators/
Thông báo miễn trừ trách nhiệm
Thông tin và các ấn phẩm này không nhằm mục đích, và không cấu thành, lời khuyên hoặc khuyến nghị về tài chính, đầu tư, giao dịch hay các loại khác do TradingView cung cấp hoặc xác nhận. Đọc thêm tại Điều khoản Sử dụng.