OPEN-SOURCE SCRIPT
Supply and Demand [tambangEA]
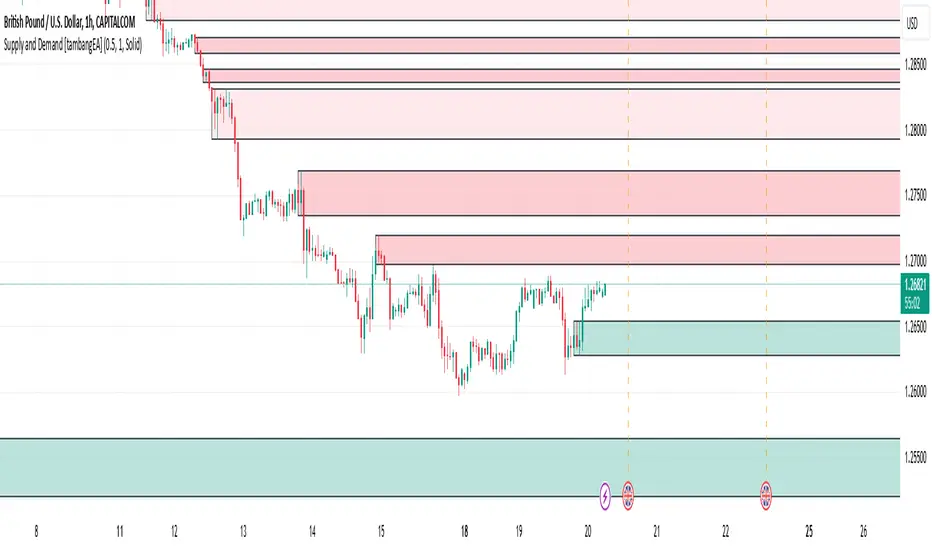
Supply and Demand [tambangEA] Indicator Overview
The Supply and Demand [tambangEA] indicator on TradingView is a technical tool designed to help traders identify areas of significant buying and selling pressure in the market. By identifying zones where price is likely to react, it helps traders pinpoint key support and resistance levels based on the concepts of supply and demand. This indicator plots zones using four distinct types of market structures:
1.Rally-Base-Rally (RBR): This structure represents a bullish continuation zone. It occurs when the price rallies (increases), forms a base (consolidates), and then rallies again. The base represents a period where buying interest builds up before the continuation of the upward movement. This zone can act as support, where buyers may step back in if the price revisits the area.
2.Drop-Base-Rally (DBR): This structure marks a bullish reversal zone. It forms when the price drops, creates a base, and then rallies. The base indicates a potential exhaustion of selling pressure and a build-up of buying interest. When price revisits this zone, it may act as support, signaling a buying opportunity.
3.Rally-Base-Drop (RBD): This structure signifies a bearish reversal zone. Here, the price rallies, consolidates into a base, and then drops. The base indicates a temporary balance before sellers overpower buyers. If price returns to this zone, it may act as resistance, with selling interest potentially re-emerging.
4.Drop-Base-Drop (DBD): This structure is a bearish continuation zone. It occurs when the price drops, forms a base, and then continues dropping. This base reflects a pause before further downward movement. The zone may act as resistance, with sellers possibly stepping back in if the price revisits the area.
Features of Supply and Demand [tambangEA] Indicator
Automatic Zone Detection: The indicator automatically identifies and plots RBR, DBR, RBD, and DBD zones on the chart, making it easier to see potential supply and demand areas.
Customizable Settings: Users can typically adjust the color and transparency of the zones, time frames for analysis, and zone persistence to suit different trading styles.
Visual Alerts: Many versions include alert functionalities, notifying users when price approaches a plotted supply or demand zone.
How to Use Supply and Demand [tambangEA] in Trading
Identify High-Probability Reversal Zones: Look for DBR and RBD zones to identify potential areas where price may reverse direction.
Trade Continuations with RBR and DBD Zones: These zones can indicate strong trends, suggesting that price may continue in the same direction.
Combine with Other Indicators: Use it alongside trend indicators, volume analysis, or price action strategies to confirm potential trade entries and exits.
This indicator is particularly useful for swing and day traders who rely on price reaction zones for entering and exiting trades.
Mã nguồn mở
Theo đúng tinh thần TradingView, tác giả của tập lệnh này đã công bố nó dưới dạng mã nguồn mở, để các nhà giao dịch có thể xem xét và xác minh chức năng. Chúc mừng tác giả! Mặc dù bạn có thể sử dụng miễn phí, hãy nhớ rằng việc công bố lại mã phải tuân theo Nội Quy.
Thông báo miễn trừ trách nhiệm
Thông tin và các ấn phẩm này không nhằm mục đích, và không cấu thành, lời khuyên hoặc khuyến nghị về tài chính, đầu tư, giao dịch hay các loại khác do TradingView cung cấp hoặc xác nhận. Đọc thêm tại Điều khoản Sử dụng.