OPEN-SOURCE SCRIPT
Stock Performance Dashboard + Sector Performance
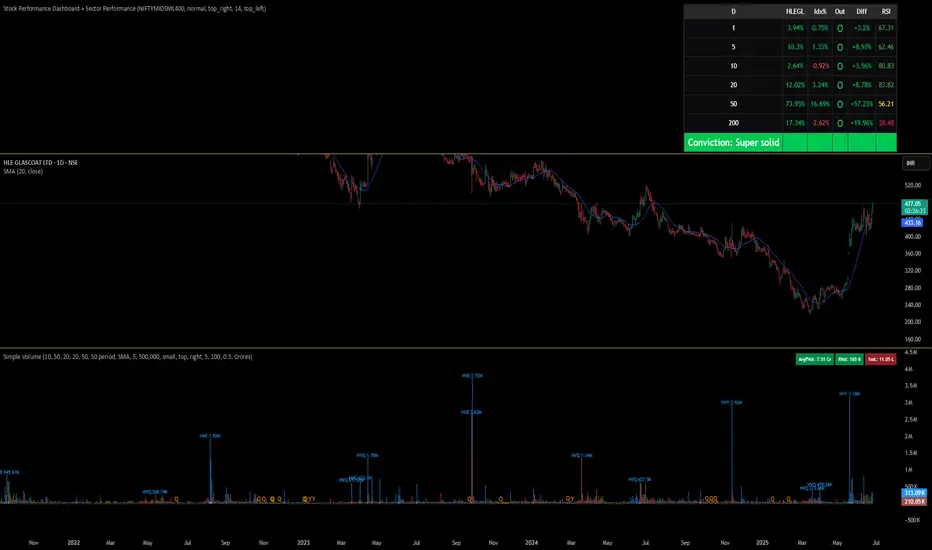
This indicator, Stock Performance Dashboard + Sector Performance, provides a comprehensive visual analysis of both individual stock performance and sectoral trends directly on your TradingView chart.
Key Features:
Performance Dashboard Table:
Displays the stock’s returns over multiple timeframes (1, 5, 10, 20, 50, 200 days) and compares them to a selected benchmark index (default: NIFTYMIDSML400).
Highlights whether the stock is outperforming the index for each period, shows the difference in performance, and includes an RSI (Relative Strength Index) column for additional momentum insight.
Calculates and displays a “conviction” score and level based on how often the stock outperforms the index across periods.
Sector Performance Table:
Ranks and displays the top-performing sectors from a predefined list of major NSE sector indices over four key periods (1D, 5D, 30D, 50D).
For each period, the top 5 sectors are shown, with color-coded performance for quick visual assessment.
Customization:
Includes options for dark/light mode, table size, position, and which columns to display.
Supports a compact “mini mode” for simplified visualization.
Usage:
This tool is ideal for traders and investors who want a quick, at-a-glance comparison of a stock’s short- and long-term momentum versus its benchmark, as well as a live snapshot of sector rotation and leadership in the Indian market. All data is presented in clear, color-coded tables for actionable decision-making.
Mã nguồn mở
Theo đúng tinh thần TradingView, tác giả của tập lệnh này đã công bố nó dưới dạng mã nguồn mở, để các nhà giao dịch có thể xem xét và xác minh chức năng. Chúc mừng tác giả! Mặc dù bạn có thể sử dụng miễn phí, hãy nhớ rằng việc công bố lại mã phải tuân theo Nội quy.
Thông báo miễn trừ trách nhiệm
Thông tin và các ấn phẩm này không nhằm mục đích, và không cấu thành, lời khuyên hoặc khuyến nghị về tài chính, đầu tư, giao dịch hay các loại khác do TradingView cung cấp hoặc xác nhận. Đọc thêm tại Điều khoản Sử dụng.