PROTECTED SOURCE SCRIPT
Monthly Trend Heatmap – Price Change by Month
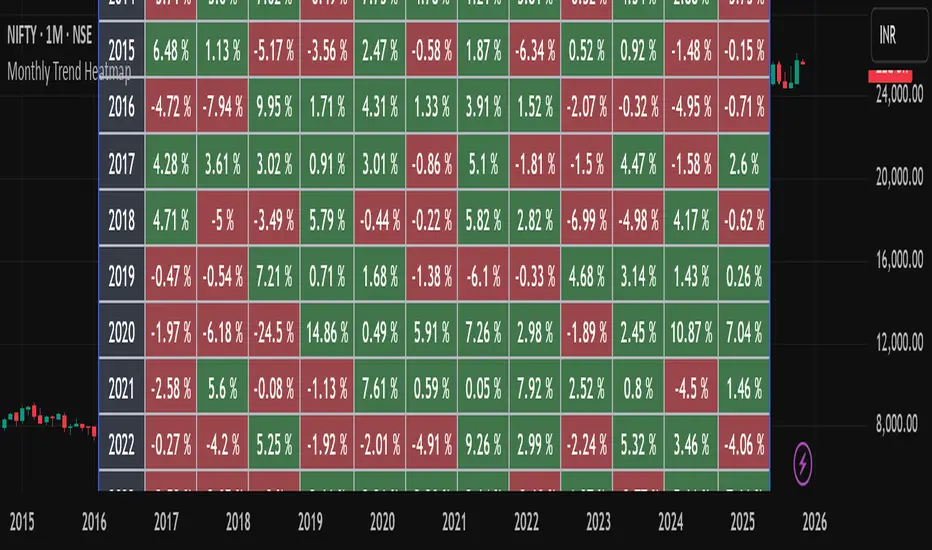
This indicator analyzes multi-year monthly price seasonality and displays it as a clear table of percentage returns for each month, from 2013 to the current year. By calculating the monthly open-to-close percentage change, it helps traders quickly identify recurring seasonal trends, positive or negative months, and long-term behavioral patterns of the selected market.
The goal of this tool is to make seasonal analysis accessible to everyday traders by presenting the data visually in a simple, structured, and easy-to-interpret format.
How It Works
This tool is not a signal generator and does not tell you when to buy or sell. It is a statistical seasonality visualizer meant to enhance decision-making.
The information provided is for educational and informational purposes only and should not be interpreted as financial, investment, or trading advice. Trading and investing in the stock market involve a high level of risk, including the potential loss of capital. Past performance does not guarantee future results, and no strategy or analysis can assure profits or prevent losses.
All examples, charts, scripts, indicators, or market discussions are strictly for demonstration, learning, and analytical purposes. No warranties or guarantees are made regarding accuracy, completeness, or future performance.
The goal of this tool is to make seasonal analysis accessible to everyday traders by presenting the data visually in a simple, structured, and easy-to-interpret format.
How It Works
- The script must be used on a 1-Month chart.
- For each month and each year, the indicator calculates:
- Monthly return = (Monthly Close – Monthly Open) / Monthly Open × 100
- The result is plotted inside a table, with green for positive months and red for negative months.
- Data auto-updates as new monthly candles form.
This tool is not a signal generator and does not tell you when to buy or sell. It is a statistical seasonality visualizer meant to enhance decision-making.
The information provided is for educational and informational purposes only and should not be interpreted as financial, investment, or trading advice. Trading and investing in the stock market involve a high level of risk, including the potential loss of capital. Past performance does not guarantee future results, and no strategy or analysis can assure profits or prevent losses.
All examples, charts, scripts, indicators, or market discussions are strictly for demonstration, learning, and analytical purposes. No warranties or guarantees are made regarding accuracy, completeness, or future performance.
Mã được bảo vệ
Tập lệnh này được đăng dưới dạng mã nguồn đóng. Tuy nhiên, bạn có thể sử dụng tự do và không giới hạn – tìm hiểu thêm tại đây.
Thông báo miễn trừ trách nhiệm
Thông tin và các ấn phẩm này không nhằm mục đích, và không cấu thành, lời khuyên hoặc khuyến nghị về tài chính, đầu tư, giao dịch hay các loại khác do TradingView cung cấp hoặc xác nhận. Đọc thêm tại Điều khoản Sử dụng.