OPEN-SOURCE SCRIPT
EMA Crossover Strategy with 50 & 200 EMAs - Faisal Anwar
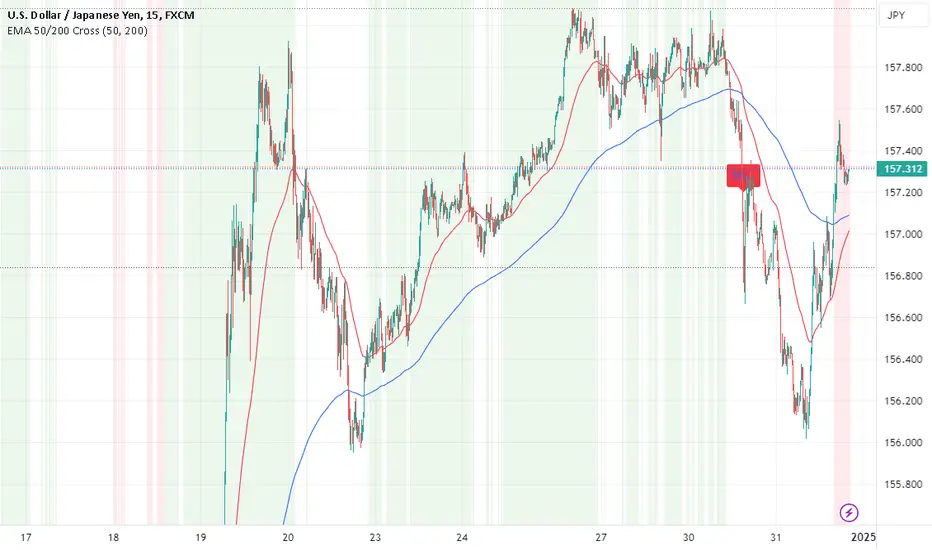
This indicator uses 50 and 200-day Exponential Moving Averages (EMAs) to identify significant trend directions and potential trading opportunities through golden crossovers and death crosses. It highlights the role of EMAs as dynamic support in uptrends and downtrends, enhancing trend-following strategies.
Detailed Explanation:
EMAs Used:
The strategy utilizes two key EMAs — the 50-day EMA and the 200-day EMA. The 50-day EMA is often seen as a medium-term trend indicator, while the 200-day EMA is regarded as a benchmark for the long-term market trend.
Golden Crossover:
This occurs when the 50-day EMA crosses above the 200-day EMA, traditionally considered a bullish signal indicating potential long positions.
Death Cross:
This event is marked by the 50-day EMA crossing below the 200-day EMA, typically viewed as a bearish signal suggesting potential short positions.
Trend Support Identification:
The script also identifies when the price is above the 50-day EMA during an uptrend (indicating ongoing support) and when the price is above the 200-day EMA during a downtrend, suggesting the EMA is acting as resistance turning into support.
Visual Tools:
The indicator plots these EMAs on the chart with distinct colors for easy differentiation and uses background color changes to visually indicate when these EMAs act as support. Buy and sell signals are clearly marked with shapes and text directly on the chart for actionable insights.
Usage Tips:
Trading Decisions:
This indicator is best used in markets with clear trends, where EMAs can effectively identify shifts in momentum and serve as reliable support or resistance levels.
Complementary Tools:
Consider combining this EMA strategy with other technical analysis tools like RSI or MACD for confirmation of signals to enhance the reliability of the trading signals.
Ideal for:
Traders looking for a visual tool to assist in identifying trend directions and optimal points for entering or exiting trades based on established technical analysis principles.
Mã nguồn mở
Theo đúng tinh thần TradingView, tác giả của tập lệnh này đã công bố nó dưới dạng mã nguồn mở, để các nhà giao dịch có thể xem xét và xác minh chức năng. Chúc mừng tác giả! Mặc dù bạn có thể sử dụng miễn phí, hãy nhớ rằng việc công bố lại mã phải tuân theo Nội quy.
Thông báo miễn trừ trách nhiệm
Thông tin và các ấn phẩm này không nhằm mục đích, và không cấu thành, lời khuyên hoặc khuyến nghị về tài chính, đầu tư, giao dịch hay các loại khác do TradingView cung cấp hoặc xác nhận. Đọc thêm tại Điều khoản Sử dụng.